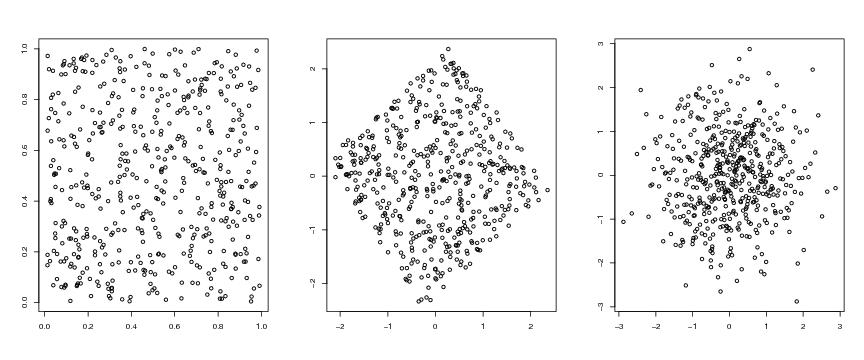
set.seed(1)
dendat<-matrix(runif(1000),500,2)

# frame 1
  plot(dendat,xlab="",ylab="")

# frame 2
  type<-"sphering"
  prodendat<-preprocess(dendat,type=type)
  plot(prodendat,xlab="",ylab="")

# frame 3
  type<-"copula"
  prodendat<-preprocess(dendat,type=type)
  plot(prodendat,xlab="",ylab="")
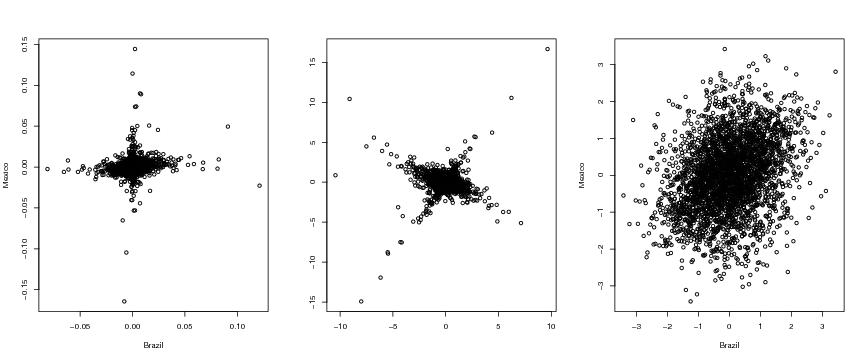
# download the file http://cc.oulu.fi/~jklemela/denstruct-html/currency.txt

file<-"~/currency.txt"
dendat<-read.table(file=file)

# frame 1
  plot(dendat,xlab="Brazil",ylab="Mexico")

# frame 2
  type<-"sphering"
  prodendat<-preprocess(dendat,type=type)
  plot(prodendat,xlab="",ylab="")

# frame 3
  type<-"copula"
  prodendat<-preprocess(dendat,type=type)
  plot(prodendat,xlab="Brazil",ylab="Mexico")
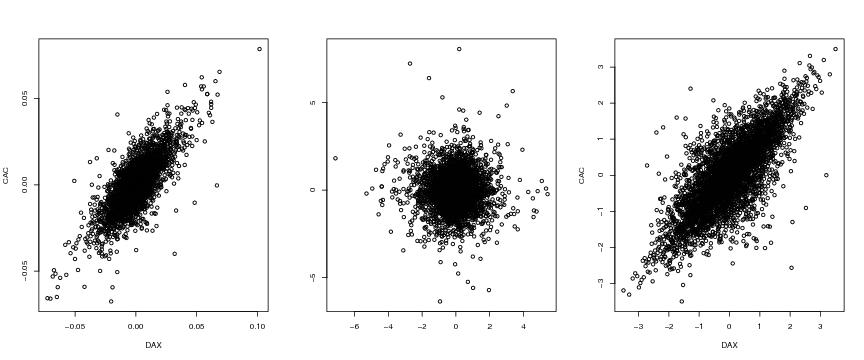
# download the file http://cc.oulu.fi/~jklemela/denstruct-html/DaxCac.txt

file<-"~/DaxCac.txt"
dendat<-read.table(file=file)

# frame 1
  plot(dendat,xlab="DAX",ylab="CAC")

# frame 2
  type<-"sphering"
  prodendat<-preprocess(dendat,type=type)
  plot(prodendat,xlab="",ylab="")

# frame 3
  type<-"copula"
  prodendat<-preprocess(dendat,type=type)
  plot(prodendat,xlab="DAX",ylab="CAC")

siemen<-5
n<-60
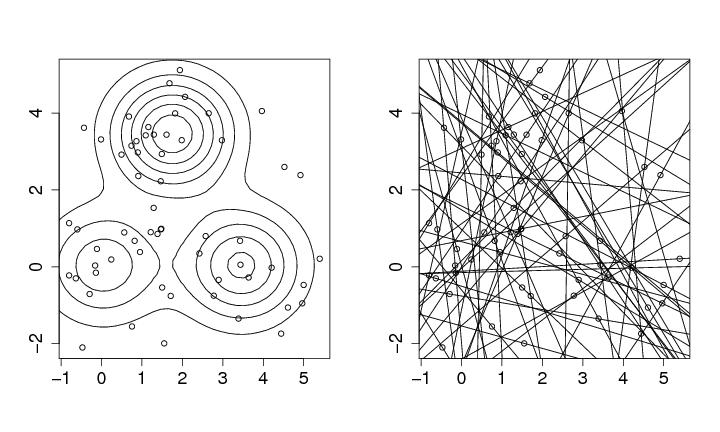
dendat<-sim.data(n=n,seed=siemen,type="mulmod")
N<-c(50,50)
egf<-sim.data(type="mulmod",N=N)
dpf<-draw.pcf(egf)
# frame 1
plot(dendat,xlab="",ylab="",cex.axis=1.5)
contour(dpf$x,dpf$y,dpf$z,drawlabels=FALSE,add=T,nlevels=7)
# frame 2
plot(dendat,xlab="",ylab="",cex.axis=1.5)
pit<-10
for (i in 1:n){
dir<-2*pi*runif(1)
x0<-dendat[i,1]
y0<-dendat[i,2]
x1<-x0+cos(dir)*pit
y1<-y0+sin(dir)*pit
segments(x0, y0, x1, y1)
x0<-dendat[i,1]
y0<-dendat[i,2]
x1<-x0-cos(dir)*pit
y1<-y0-sin(dir)*pit
segments(x0, y0, x1, y1)
}
gauss<-function(t,h=1){ return(exp(-t^2/(2*h^2))/(sqrt(2*pi)*h))}

bart<-function(t,h=1){
 if (((t/h)<(-1)) || ((t/h)>1)) res<-0
 else res<-3*(1-(t/h)^2)/(4*h)
 return(res)
}

reg<-function(t,h=1,a=0){
  res<-a+exp(-2*(t/h))*(t/h)^5
  return(res)
}
plot(x,reg(x,h=0.2,a=0.2))

regden<-function(x,y,epsi=1){
  lenx<-length(x)
  leny<-length(y)
  z<-matrix(0,lenx,leny)
  for (i in 1:lenx){
     for (j in 1:leny){
        r<-reg(x[i],h=0.2,a=0.2)
        ehd<-gauss(y[j]-r,h=epsi)
        des<-bart(x[i]-0.5,h=0.5)
        z[i,j]<-ehd*des
     }
   }
   return(z)
}

x<-seq(0,1,0.02)
y<-seq(-0.5,1.7,0.02)
z<-regden(x,y,epsi=0.3)

sim.reject<-function(n,seed=1)
{
 dendat<-matrix(0,n,1)
 set.seed(1)
 ota<-0
 while (ota