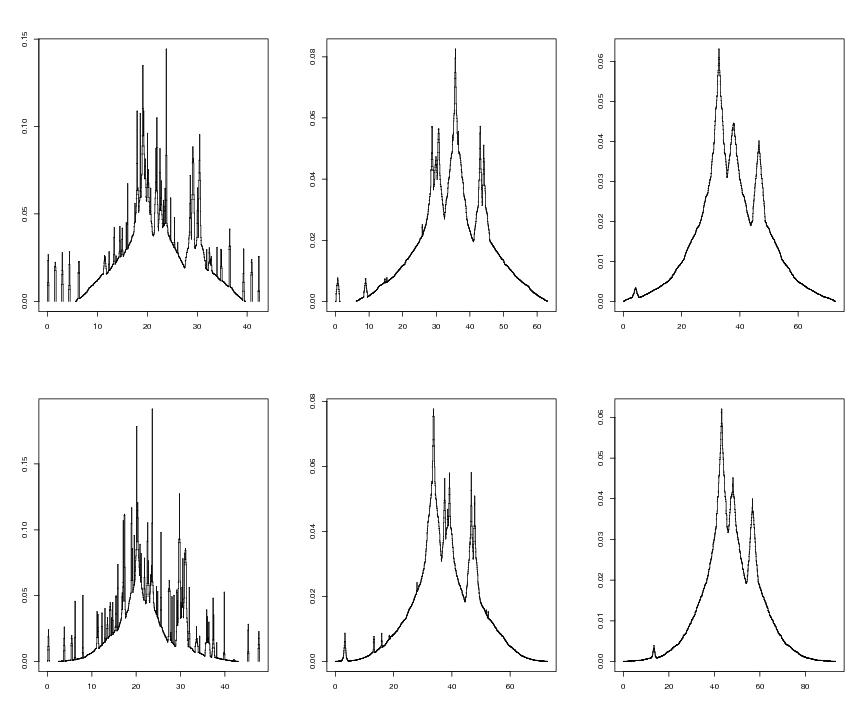
n<-200
seed<-5
dendat<-sim.data(type="mulmod",n=n,seed=seed)

N<-c(32,32)

h<-0.3
pcfa<-pcf.kern(dendat,h,N,kernel="epane")
lsta<-leafsfirst(pcfa)
lsta1<-treedisc(lsta,pcfa,ngrid=120)

h<-0.6
pcfb<-pcf.kern(dendat,h,N,kernel="epane")
lstb<-leafsfirst(pcfb)
lstb1<-treedisc(lstb,pcfb,ngrid=120)

h<-0.9
pcfc<-pcf.kern(dendat,h,N,kernel="epane")
lstc<-leafsfirst(pcfc)
lstc1<-treedisc(lstc,pcfc,ngrid=120)

h<-0.2
pcfa<-pcf.kern(dendat,h,N,kernel="gauss")
lstd<-leafsfirst(pcfa)

h<-0.3
pcfa<-pcf.kern(dendat,h,N,kernel="gauss")
lste<-leafsfirst(pcfa)

h<-0.45
pcfa<-pcf.kern(dendat,h,N,kernel="gauss")
lstf<-leafsfirst(pcfa)

# frame 1
   plotvolu(lsta)

# frame 2
   plotvolu(lstb)

# frame 3
   plotvolu(lstc)

# frame 4
   plotvolu(lstd)

# frame 5
   plotvolu(lste)

# frame 6
   plotvolu(lstf)
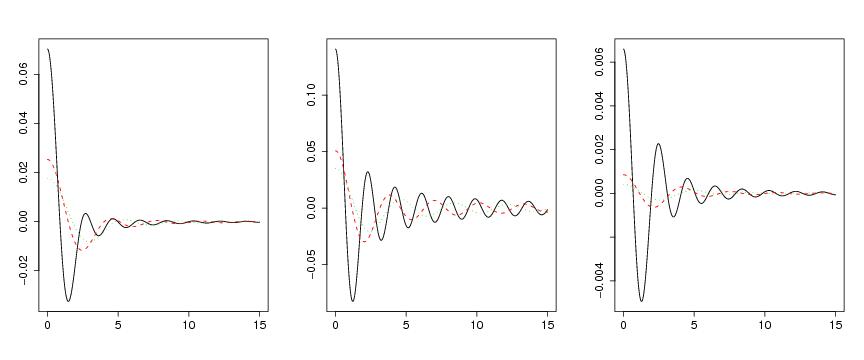
radonkernel<-function(d,r,h,makeplot=TRUE,lkmeva=1000,end=50)
{
  step<-end/(lkmeva-1)
  useq<-seq(0,end,step)
  kernel<-matrix(0,length(useq),1)
  c1<-2*(2*pi)^(-1)
  ck<-(2*pi)^(-d+1)/2

  lkm<-1000
  a<-0
  l<-1/h
  step<-(l-a)/lkm
  x<-seq(a,l,step)

  for (j in 1:length(useq)){
     int<-0
     u<-useq[j]
     for (i in 1:length(x)){
        t<-x[i]
        if (r=="inf") int<-int+step*cos(t*u)*t^{d-1}
        else int<-int+step*cos(t*u)*t^{d-1}*(1-(h*t)^r)
     }
     kernel[j]<-c1*ck*int
  }
  if (makeplot) plot(useq,kernel,type="l")
  else return(list(x=useq,y=kernel))
}

lkmeva<-500
end<-15
h<-c(0.3,0.5,0.6)

d<-2
r<-2
xmat<-matrix(0,lkmeva,length(h))
ymat<-matrix(0,lkmeva,length(h))
for (i in 1:length(h)){
   rk<-radonkernel(d,r,h[i],lkmeva=lkmeva,makeplot=FALSE,end=end)
   xmat[,i]<-rk$x
   ymat[,i]<-rk$y
}

d<-2
r<-"inf"
xmat2<-matrix(0,lkmeva,length(h))
ymat2<-matrix(0,lkmeva,length(h))
for (i in 1:length(h)){
   rk<-radonkernel(d,r,h[i],lkmeva=lkmeva,makeplot=FALSE,end=end)
   xmat2[,i]<-rk$x
   ymat2[,i]<-rk$y
}

d<-4
r<-2
xmat3<-matrix(0,lkmeva,length(h))
ymat3<-matrix(0,lkmeva,length(h))
for (i in 1:length(h)){
   rk<-radonkernel(d,r,h[i],lkmeva=lkmeva,makeplot=FALSE,end=end)
   xmat3[,i]<-rk$x
   ymat3[,i]<-rk$y
}

# frame 1
  matplot(xmat,ymat,type="l",xlab="",ylab="",cex.axis=1.5)

# frame 2
  matplot(xmat2,ymat2,type="l",xlab="",ylab="",cex.axis=1.5)

# frame 3
  matplot(xmat3,ymat3,type="l",xlab="",ylab="",cex.axis=1.5)