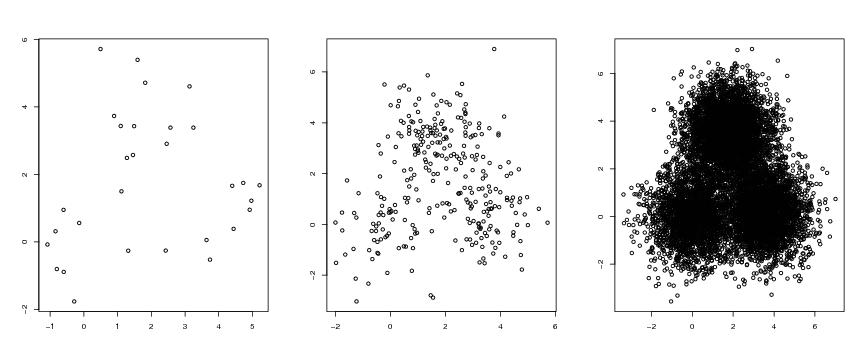
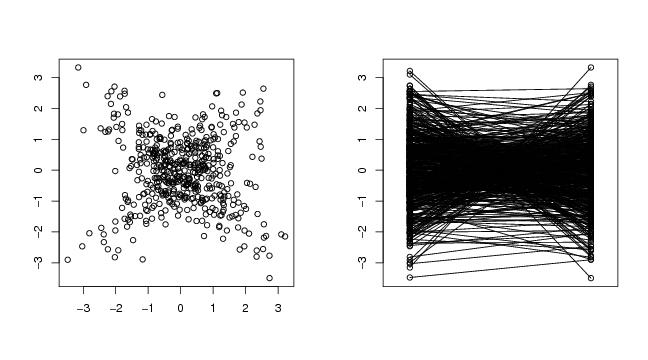
siemen<-5
type<-"mulmod"

n<-30
dendat1<-sim.data(n=n,seed=siemen,type=type)

n<-300
dendat2<-sim.data(n=n,seed=siemen,type=type)

n<-10000
dendat3<-sim.data(n=n,seed=siemen,type=type)

# frame 1
  plot(dendat1[,1],dendat1[,2],xlab="",ylab="")

# frame 2
  plot(dendat2[,1],dendat2[,2],xlab="",ylab="")

# frame 3
  plot(dendat3[,1],dendat3[,2],xlab="",ylab="")
d<-2
mixnum<-1
M<-matrix(0,mixnum,d)
M[1,]<-c(0,0)
sig<-matrix(1,mixnum,d)
sig[1,1]<-0.5
sig[1,2]<-1.5
p<-matrix(1,mixnum,1)
p<-p/sum(p)
n<-20
type<-"mixt"
dendat<-sim.data(n,M=M,sig=sig,p=p,seed=1,d=d,type=type)
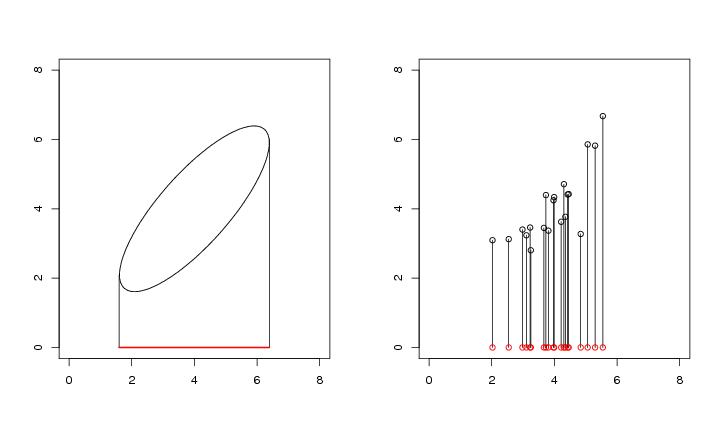
theta<-3*pi/4
rotmat<-matrix(c(cos(theta),-sin(theta),sin(theta),cos(theta)),2,2)
dendat<-dendat%*%rotmat
siirto<-4
dendat<-dendat+siirto
N<-c(60,60)
support<-c(-3.5,3.5,-3.5,3.5)
pcf<-pcf.func("mixt",N,sig=sig,M=M,p=p,theta=theta,support=support)
dp<-draw.pcf(pcf,pnum=c(90,90))
dp$x<-dp$x+siirto
dp$y<-dp$y+siirto
# frame 1
contour(dp$x,dp$y,dp$z,
levels=c(0.02),
xlim=c(0,8),ylim=c(0,8),
drawlabels=FALSE)
# locator(1)
segments(1.598731,2.081556,1.598731,0)
segments(6.39,6.016467,6.39,0)
segments(1.598731,0,6.39,0,col="red",lwd=2)
# frame 2
plot(dendat,
xlim=c(0,8),ylim=c(0,8),
xlab="",ylab="")
for (i in 1:n){
lines(c(dendat[i,1],dendat[i,1]),c(dendat[i,2],0))
points(dendat[i,1],0,col="red")
}
d<-2
mixnum<-1
M<-matrix(0,mixnum,d)
M[1,]<-c(0,0)
sig<-matrix(1,mixnum,d)
sig[1,1]<-0.5
sig[1,2]<-1.5
p<-matrix(1,mixnum,1)
p<-p/sum(p)
n<-20
type<-"mixt"
dendat<-sim.data(n,M=M,sig=sig,p=p,seed=1,d=d,type=type)
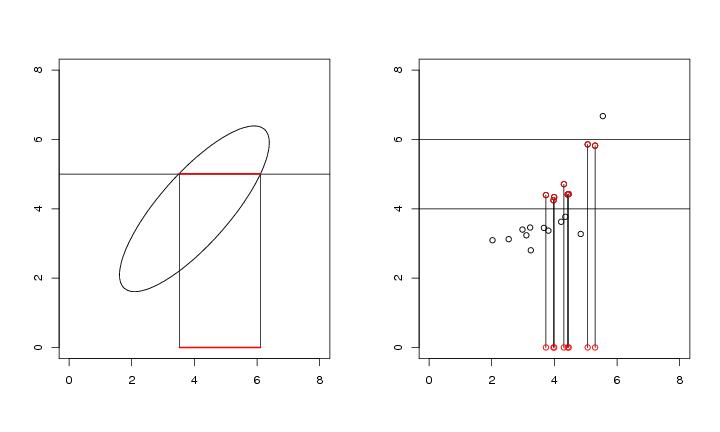
theta<-3*pi/4
rotmat<-matrix(c(cos(theta),-sin(theta),sin(theta),cos(theta)),2,2)
dendat<-dendat%*%rotmat
siirto<-4
dendat<-dendat+siirto
N<-c(60,60)
support<-c(-3.5,3.5,-3.5,3.5)
pcf<-pcf.func("mixt",N,sig=sig,M=M,p=p,theta=theta,support=support)
dp<-draw.pcf(pcf,pnum=c(90,90))
dp$x<-dp$x+siirto
dp$y<-dp$y+siirto
# frame 1
contour(dp$x,dp$y,dp$z,
levels=c(0.02),
xlim=c(0,8),ylim=c(0,8),
drawlabels=FALSE)
# locator(1)
segments(3.524957,5.008233,3.524957,0)
segments(6.107215,5.008233,6.107215,0)
segments(3.524957,0,6.107215,0,col="red",lwd=2)
segments(3.524957,5.008233,6.107215,5.008233,col="red",lwd=2)
# frame 2
plot(dendat,
xlim=c(0,8),ylim=c(0,8),
xlab="",ylab="")
ala<-4
yla<-6
lines(c(-1,9),c(ala,ala))
lines(c(-1,9),c(yla,yla))
for (i in 1:n){
if ((dendat[i,2]<=yla) && (dendat[i,2]>=ala)){
lines(c(dendat[i,1],dendat[i,1]),c(dendat[i,2],0))
points(dendat[i,1],0,col="red")
points(dendat[i,1],dendat[i,2],col="red")
}
}
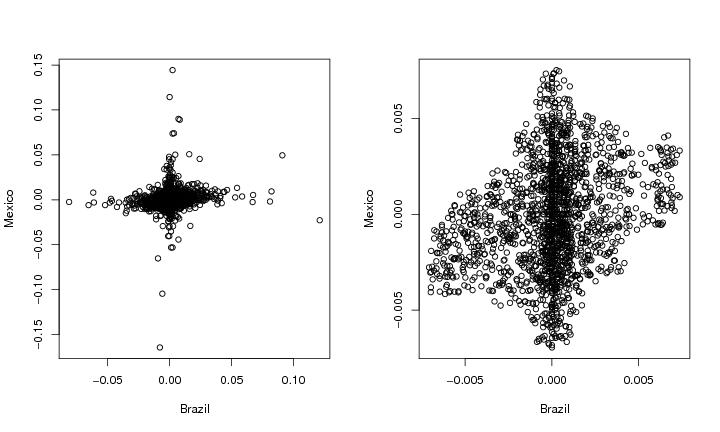
# download the file http://cc.oulu.fi/~jklemela/denstruct-html/currency.txt

file<-"~/currency.txt"

dendat<-read.table(file=file)

maxk<-30
radmat<-nn.radit(dendat,maxk)    # here, for example, we need denpro.R

k<-30
p<-0.05

sub<-nn.likeset(dendat,radmat,k,p)
dendatsub<-dendat[sub,]

# frame 1
  plot(dendat,ylab="Mexico",xlab="Brazil")

# frame 2
  plot(dendatsub,ylab="Mexico",xlab="Brazil")
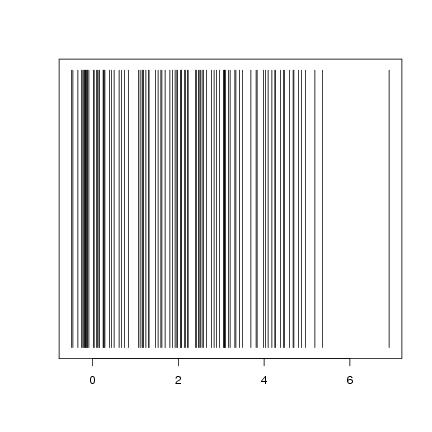
n<-100
d<-1
seed<-200503
dendat<-sim.data(n=n,type="1d2modal",seed=seed)

# frame
plot(x="",y="",xlim=c(min(dendat),max(dendat)),ylim=c(0,1),yaxt="n",
xlab="",ylab="")
segments(dendat,rep(0,n),dendat,rep(1,n))
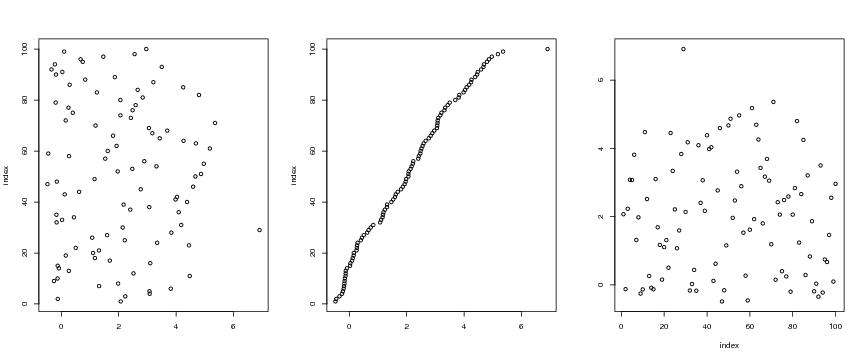
n<-100
d<-1
seed<-200503
dendat<-sim.data(n=n,type="1d2modal",seed=seed)

# frame 1
plot(dendat,c(1:n),ylab="index",xlab="")

# frame 2
ordi<-order(dendat)
dendatord<-dendat[ordi]
plot(dendatord,c(1:n),ylab="index",xlab="")

# frame 3
plot(c(1:n),dendat,xlab="index",ylab="")
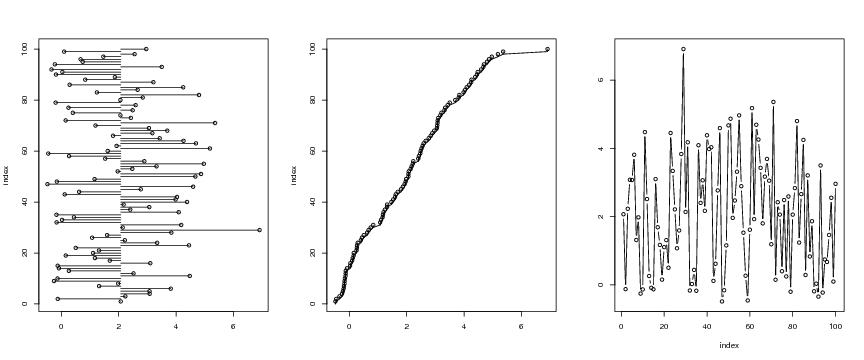
n<-100
d<-1
seed<-200503
dendat<-sim.data(n=n,type="1d2modal",seed=seed)

# frame 1
plot(dendat,c(1:n),xlab="",ylab="index")
center<-mean(dendat)
for (i in 1:n){
        x0<-dendat[i]
        y0<-i
        x1<-center
        y1<-i
        segments(x0, y0, x1, y1)
}

# frame 2
ordi<-order(dendat)
dendatord<-dendat[ordi]
plot(dendatord,c(1:n),ylab="index",xlab="")
ycur<-0
ordi<-order(dendat)
dendatord<-dendat[ordi]
n<-length(dendat)
for(i in 1:(n-1)){
    segments(dendatord[i],ycur,dendatord[i],ycur+1)
    segments(dendatord[i],ycur+1/n,dendatord[i+1],ycur+1)
    ycur<-ycur+1
}
segments(dendatord[n],ycur,dendatord[n],ycur+1)

# frame 3
plot(c(1:n),dendat,xlab="index",ylab="",type="b")

n<-500

# frame 1
# student
set.seed(1)
dendat<-rt(n,df=3)
maxi<-max(dendat)
mini<-min(dendat)
plot(c(1:n),dendat,xlab="index",ylab="",type="b",ylim=c(mini,maxi))

# frame 2
# double exponential
set.seed(1)
dendat<-rexp(n,rate=1)
sign<-2*round(runif(n))-1
dendat<-sign*dendat
plot(c(1:n),dendat,xlab="index",ylab="",type="b",ylim=c(mini,maxi))

# frame 3
# gauss
set.seed(1)
dendat<-rnorm(n)
plot(c(1:n),dendat,xlab="index",ylab="",type="b",ylim=c(mini,maxi))
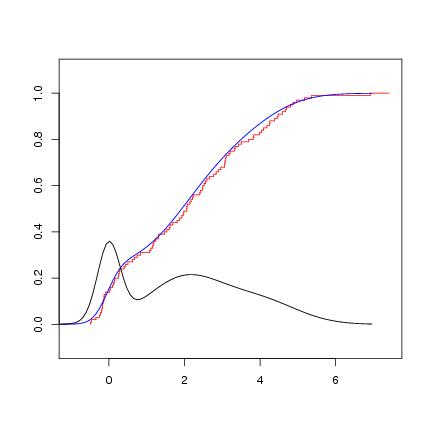
n<-100
d<-1
seed<-200503
dendat<-sim.data(n=n,type="1d2modal",seed=seed)

# frame
xepsi<-0.5
yepsi<-0.1
dist.func(dendat,xepsi,yepsi,col="red")

func<-"mixture"
N<-100
type<-"1d2modal"
ef.distr<-sim.data(N=N,type=type,distr=TRUE)
ef.dens<-sim.data(N=N,type=type)
dp<-draw.pcf(ef.distr,pnum=N)
dp.dens<-draw.pcf(ef.dens,pnum=N)

matpoints(dp$x,dp$y,type="l",xlab="",ylab="",col="blue")

matpoints(dp.dens$x,dp.dens$y,type="l",xlab="",ylab="",col="black")
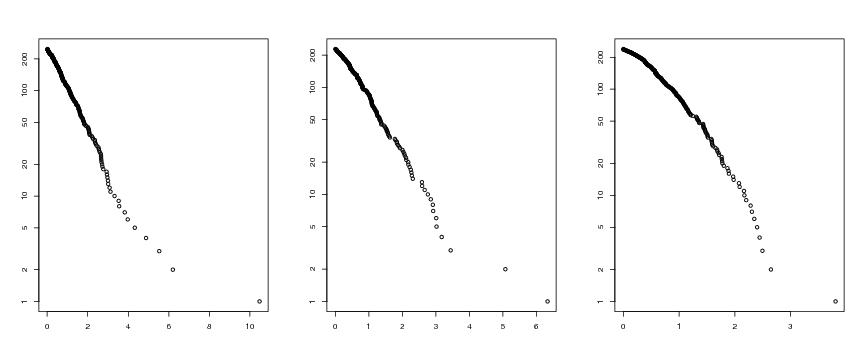
n<-500

# frame 1
# student
set.seed(1)
dendat<-rt(n,df=3)
dist.func(dendat,type="right.tail")

# frame 2
# double exponential
set.seed(1)
dendat<-rexp(n,rate=1)
sign<-2*round(runif(n))-1
dendat<-sign*dendat
dist.func(dendat,type="right.tail")

# frame 3
# gauss
set.seed(1)
dendat<-rnorm(n)
dist.func(dendat,type="right.tail")
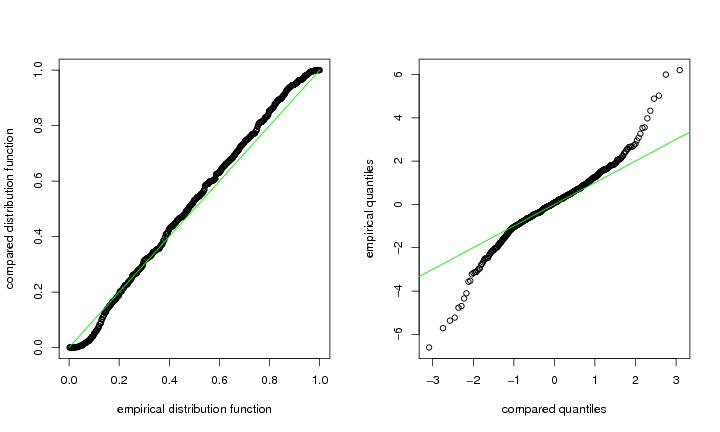
n<-500
compa="gauss"
df<-3
set.seed(1)
dend<-rt(n,df=df)
dendat<-matrix(dend,n,1)

# frame 1
pp.plot(dendat,compa=compa,df=df)

# frame 2
qq.plot(dendat,compa=compa,df=df)
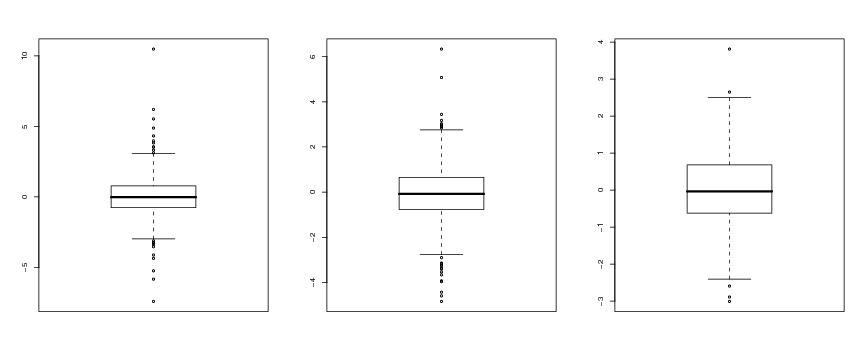
n<-500

# frame 1
# student
set.seed(1)
dendat<-rt(n,df=3)
boxplot(dendat)

# frame 2
# double exponential
set.seed(1)
dendat<-rexp(n,rate=1)
sign<-2*round(runif(n))-1
dendat<-sign*dendat
boxplot(dendat)

# frame 3
# gauss
set.seed(1)
dendat<-rnorm(n)
boxplot(dendat)
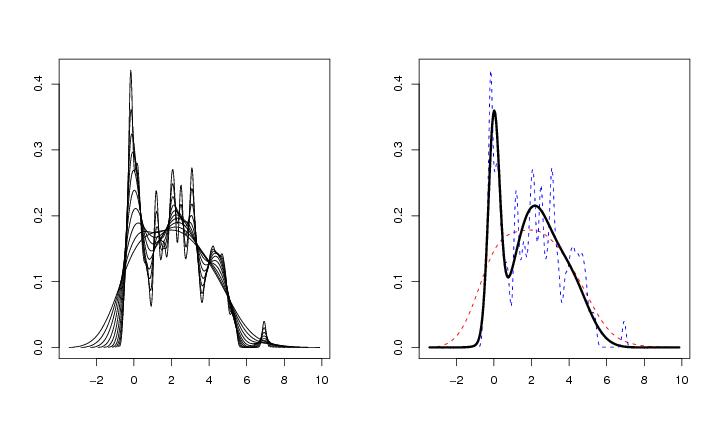
n<-100
d<-1
seed<-200503
dendat<-sim.data(n=n,type="1d2modal",seed=seed)

h1<-0.1
h2<-1
lkm<-10
base<-10
hseq<-hgrid(h1,h2,lkm,base)
N<-256
support<-c(-3,10)
lk<-lstseq.kern(dendat,hseq,N,kernel="gauss",support=support)

h<-hseq[1]
pk<-pcf.kern(dendat,h,N,kernel="gauss",support=support)
dp<-draw.pcf(pk,dens=TRUE,pnum=N)

h<-hseq[10]
pk<-pcf.kern(dendat,h,N,kernel="gauss",support=support)
dpp<-draw.pcf(pk,dens=TRUE,pnum=N)

func<-"mixt"
d<-1
mu<-c(0,2,4)
mixnum<-length(mu)
sig<-matrix(1,mixnum,d)
sig[1]<-0.3
p<-matrix(1,mixnum,1)
p[2]<-2
p<-p/sum(p)
xala<-dp$x[1]
xyla<-dp$x[length(dp$x)]
support<-c(xala,xyla)
ef<-pcf.func(func,N,M=mu,sig=sig,p=p,support=support)
dp2<-draw.pcf(ef,pnum=N,dens=TRUE)

# frame 1
plot.kernscale(lk,dens=TRUE,pnum=N)

# frame 2
plot(x="",y="",xlab="",ylab="",xlim=c(xala,xyla),ylim=c(0,max(dpp$y)))
matpoints(dp$x,dp$y,type="l",xlab="",ylab="",col="red",lty="dashed")
matlines(dpp$x,dpp$y,type="l",xlab="",ylab="",col="blue",lty="dashed")
matlines(dp2$x,dp2$y,type="l",xlab="",ylab="",col="black",lty="solid",lwd=3)
kern1d<-function(dendat,h)
{
n<-length(dendat)
eva<-matrix(0,n,1)
for (i in 1:n){
   point<-dendat[i]
   summa<-0
   for (j in 1:n){
       x<-point-dendat[j]
       summa<-summa+evanor(x/h)/h
   }
   eva[i]<-summa/n
}
return(eva)
}

n<-100
seed<-200503
dendat<-sim.data(n=n,type="1d2modal",seed=seed)

# frame 1
  h<-0.2
  level<-kern1d(dendat,h)
  plot(dendat,level,xlab="")

# frame 2
  h<-1
  level<-kern1d(dendat,h)
  plot(dendat,level,xlab="")
# rectangular spirals
spiral<-function(d,lkm,hila=3)
{
n<-1
for (i in 1:lkm) n<-n+d*i*hila
curve<-matrix(0,n,d)
level<-matrix(0,n,1)

point<-2
step<-0
sign<--1
cur<-curve[1,]
for (i in 1:lkm){
   step<-step+1
   sign<--sign
   for (j in 1:d){
        dire<-rep(0,d)
        dire[j]<-1
        add<-step*sign*dire
        nstep<-i*hila
        for (k in 1:nstep){
               curve[point,]<-cur+add/nstep
               level[point]<-level[point-1]+1/nstep

               cur<-curve[point,]
               point<-point+1
        }
   }
}
return(list(curve=curve,level=level))
}

# frame 1
d<-2
lkm<-5
spi<-spiral(d,lkm)
plot(spi$curve[,1],spi$curve[,2],type="l",
xlab="coordinate 1",ylab="coordinate 2")

# frame 2
lkm<-5
hila<-20
spi<-spiral(d,lkm,hila)
dendat<-spi$curve
level<-spi$level
plot(dendat[,1],level,ylab="level",xlab="coordinate 1",type="l")#pch=20)

# frame 3
plot(dendat[,2],level,ylab="level",xlab="coordinate 2",type="l")
# Archimedean spiral
spiral2d<-function(a,n,lkm=3,type="archimed")
{
d<-2
end<-lkm*2*pi
step<-end/n

curve<-matrix(0,n,d)
level<-matrix(0,n,1)

if (type=="archimed"){
   for (i in 1:n){
       phi<-i*step
       r<-a*phi
       curve[i,1]<-r*cos(phi)
       curve[i,2]<-r*sin(phi)
       level[i]<-r
   }
}
if (type=="hyperbol"){
   for (i in 1:n){
       phi<-i*step
       r<-a/phi
       curve[i,1]<-r*cos(phi)
       curve[i,2]<-r*sin(phi)
       level[i]<-r
   }
}
return(list(curve=curve,level=level))
}

a<-1
n<-100
lkm<-3
type<-"archimed"
spi<-spiral2d(a,n,lkm,type)

# frame 1
plot(spi$curve[,1],spi$curve[,2],type="l",
xlab="coordinate 1",ylab="coordinate 2")

# frame 2
dendat<-spi$curve
level<-spi$level
plot(dendat[,1],level,ylab="level",xlab="coordinate 1",type="l")#pch=20)

# frame 3
plot(dendat[,2],level,ylab="level",xlab="coordinate 2",type="l")
# Hyperbolic spiral

# frame 1
a<-1
low<-0.05
end<-2
n<-1000
step<-(end-low)/n
curve<-matrix(0,n,2)
level<-matrix(0,n,1)
for (i in 1:n){
       r<-low+i*step
       phi<-a/r
       curve[i,1]<-r*cos(phi)
       curve[i,2]<-r*sin(phi)
       level[i]<-r
}
matplot(curve[,1],curve[,2],type="l",xlab="coordinate 1", ylab="coordinate 2")

# frame 2
# level plot, coordinate 1

coordi<-1

dendat<-curve
lenni<-dim(dendat)[1]
level<-matrix(0,lenni,1)
for (i in 1:lenni) level[i]<-sqrt(sum(dendat[i,]^2))
plot(dendat[,coordi],level,ylab="level",xlab="coordinate 1",type="l",
log="y")

# frame 3
# level plot, coordinate 2

coordi<-2

dendat<-curve
lenni<-dim(dendat)[1]
level<-matrix(0,lenni,1)
for (i in 1:lenni) level[i]<-sqrt(sum(dendat[i,]^2))
plot(dendat[,coordi],level,ylab="level",xlab="coordinate 2",type="l",
log="y")
# rectangular spirals
spiral<-function(d,lkm,hila=3)
{
n<-1
for (i in 1:lkm) n<-n+d*i*hila
curve<-matrix(0,n,d)
level<-matrix(0,n,1)
point<-2
step<-0
sign<--1
cur<-curve[1,]
for (i in 1:lkm){
step<-step+1
sign<--sign
for (j in 1:d){
dire<-rep(0,d)
dire[j]<-1
add<-step*sign*dire
nstep<-i*hila
for (k in 1:nstep){
curve[point,]<-cur+add/nstep
level[point]<-level[point-1]+1/nstep
cur<-curve[point,]
point<-point+1
}
}
}
return(list(curve=curve,level=level))
}
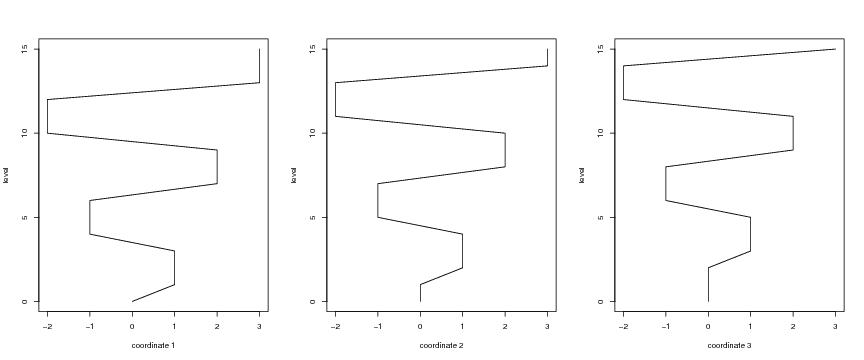
d<-3
lkm<-5
hila<-20
spi<-spiral(d,lkm,hila)
dendat<-spi$curve
level<-spi$level
# frame 1
plot(dendat[,1],level,ylab="level",xlab="coordinate 1",type="l")
# frame 2
plot(dendat[,2],level,ylab="level",xlab="coordinate 2",type="l")
# frame 3
plot(dendat[,3],level,ylab="level",xlab="coordinate 3",type="l")
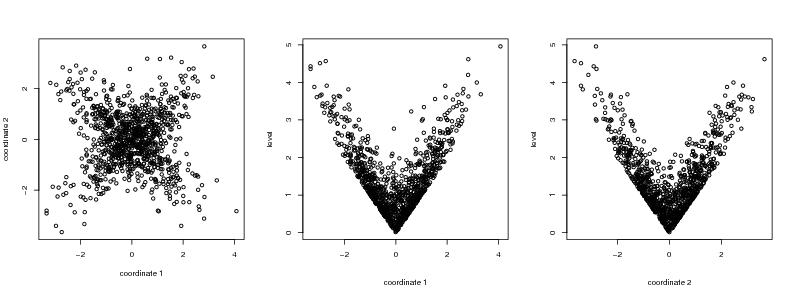
seed<-1
type<-"cross"
n<-1000
d<-2
dendat<-sim.data(n=n,type=type,seed=seed)

level1<-seq(1,n)
cente<-c(mean(dendat[,1]),mean(dendat[,2]))
level2<-sqrt(pituus(dendat-cente))

# frame 1
   plot(dendat,xlab="coordinate 1", ylab="coordinate 2")

# frame 2
   i<-1
   plot(dendat[,i],level1,ylab="level",xlab="")
   title(sub=paste("coordinate",as.character(i)))

# frame 3
   i<-2
   plot(dendat[,i],level1,ylab="level",xlab="")
   title(sub=paste("coordinate",as.character(i)))
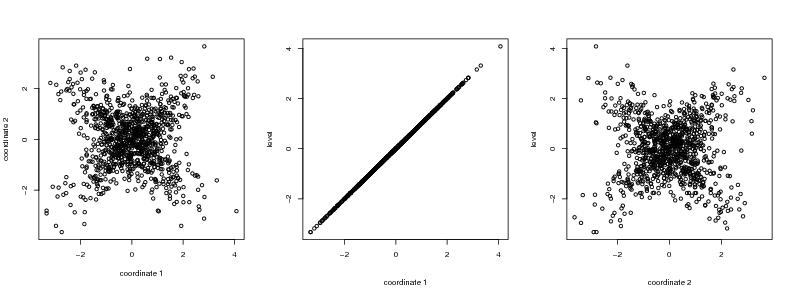
seed<-1
type<-"cross"
n<-1000
d<-2
dendat<-sim.data(n=n,type=type,seed=seed)

cente<-c(mean(dendat[,1]),mean(dendat[,2]))
level2<-sqrt(pituus(dendat-cente))

# frame 1
   plot(dendat,xlab="coordinate 1", ylab="coordinate 2")

# frame 2
   i<-1
   plot(dendat[,i],level2,ylab="level",xlab="")
   title(sub=paste("coordinate",as.character(i)))

# frame 3
   i<-2
   plot(dendat[,i],level2,ylab="level",xlab="")
   title(sub=paste("coordinate",as.character(i)))
seed<-1
type<-"cross"
n<-1000
d<-2
dendat<-sim.data(n=n,type=type,seed=seed)


level3<-dendat[,1]

# frame 1
   plot(dendat,xlab="coordinate 1", ylab="coordinate 2")

# frame 2
   i<-1
   plot(dendat[,i],level3,ylab="level",xlab="")
   title(sub=paste("coordinate",as.character(i)))

# frame 3
   i<-2
   plot(dendat[,i],level3,ylab="level",xlab="")
   title(sub=paste("coordinate",as.character(i)))

seed<-1
type<-"cross"
n<-1000
d<-2
dendat<-sim.data(n=n,type=type,seed=seed)

thre<-2.3
dendat.cut<-matrix(0,1000,2)
saatu<-0
for (i in 1:1000){
  x<-dendat[i,1]
  y<-dendat[i,2]
  if (x+y<=thre){
       saatu<-saatu+1
       dendat.cut[saatu,]<-dendat[i,]
  }
}
dendat.cut<-dendat.cut[1:saatu,]

cente3<-c(mean(dendat.cut[,1]),mean(dendat.cut[,2]))
level3<-sqrt(pituus(dendat.cut-cente3))

# frame 1
   plot(dendat.cut,xlim=c(-4,4),ylim=c(-4,4),
   xlab="coordinate 1", ylab="coordinate 2")

# frame 2
   i<-1
   plot(dendat.cut[,i],level3,ylab="level",xlab="")
   title(sub=paste("coordinate",as.character(i)))

# frame 3
   i<-2
   plot(dendat.cut[,i],level3,ylab="level",xlab="")
   title(sub=paste("coordinate",as.character(i)))
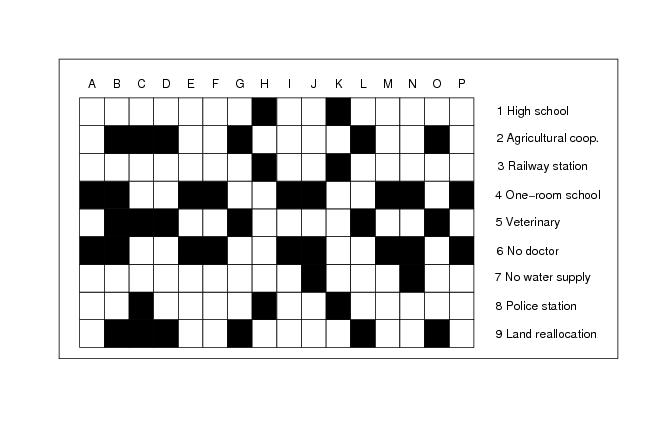
rows<-9
columns<-16

colmat<-matrix("white",columns,rows)
colmat[2,1]<-"black"
colmat[3,1]<-"black"
colmat[4,1]<-"black"
colmat[7,1]<-"black"
colmat[12,1]<-"black"
colmat[15,1]<-"black"
colmat[3,2]<-"black"
colmat[8,2]<-"black"
colmat[11,2]<-"black"
colmat[10,3]<-"black"
colmat[14,3]<-"black"
colmat[1,4]<-"black"
colmat[2,4]<-"black"
colmat[5,4]<-"black"
colmat[6,4]<-"black"
colmat[9,4]<-"black"
colmat[10,4]<-"black"
colmat[13,4]<-"black"
colmat[14,4]<-"black"
colmat[16,4]<-"black"
colmat[2,5]<-"black"
colmat[3,5]<-"black"
colmat[4,5]<-"black"
colmat[7,5]<-"black"
colmat[12,5]<-"black"
colmat[15,5]<-"black"
colmat[1,6]<-"black"
colmat[2,6]<-"black"
colmat[5,6]<-"black"
colmat[6,6]<-"black"
colmat[9,6]<-"black"
colmat[10,6]<-"black"
colmat[13,6]<-"black"
colmat[14,6]<-"black"
colmat[16,6]<-"black"
colmat[8,7]<-"black"
colmat[11,7]<-"black"
colmat[2,8]<-"black"
colmat[3,8]<-"black"
colmat[4,8]<-"black"
colmat[7,8]<-"black"
colmat[12,8]<-"black"
colmat[15,8]<-"black"
colmat[8,9]<-"black"
colmat[11,9]<-"black"

plot(x="",y="",xlim=c(0,columns+5),ylim=c(0,rows+1),
xlab="",ylab="",yaxt="n",xaxt="n")

for (i in 1:columns){
  for (j in 1:rows){

  polygon(x=c(i-1,i-1,i,i),y=c(j-1,j,j,j-1),col=colmat[i,j])

  }
}

vec<-c("A","B","C","D","E","F","G","H","I","J","K","L","M","N","O","P")
add<-0.5
lis<-0.5
for (i in 1:columns){
   text(i-add,rows+lis,vec[i])
}
tec<-c(
"1 High school         ",
"2 Agricultural coop.",
"3 Railway station   ",
"4 One-room school",
"5 Veterinary            ",
"6 No doctor            ",
"7 No water supply   ",
"8 Police station       ",
"9 Land reallocation ")
add<-3
lis<--0.5
for (i in 1:rows){
   text(columns+add,rows-i+1+lis,tec[i])
}
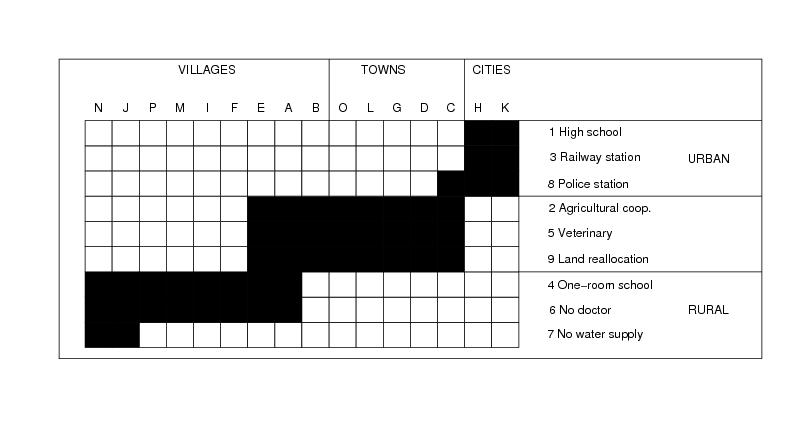
rows<-9
columns<-16

colmat<-matrix("white",columns,rows)
colmat[1,1]<-"black"
colmat[2,1]<-"black"
colmat[1,2]<-"black"
colmat[2,2]<-"black"
colmat[3,2]<-"black"
colmat[4,2]<-"black"
colmat[5,2]<-"black"
colmat[6,2]<-"black"
colmat[7,2]<-"black"
colmat[8,2]<-"black"
colmat[1,3]<-"black"
colmat[2,3]<-"black"
colmat[3,3]<-"black"
colmat[4,3]<-"black"
colmat[5,3]<-"black"
colmat[6,3]<-"black"
colmat[7,3]<-"black"
colmat[8,3]<-"black"
colmat[7,4]<-"black"
colmat[8,4]<-"black"
colmat[9,4]<-"black"
colmat[10,4]<-"black"
colmat[11,4]<-"black"
colmat[12,4]<-"black"
colmat[13,4]<-"black"
colmat[14,4]<-"black"
colmat[7,5]<-"black"
colmat[8,5]<-"black"
colmat[9,5]<-"black"
colmat[10,5]<-"black"
colmat[11,5]<-"black"
colmat[12,5]<-"black"
colmat[13,5]<-"black"
colmat[14,5]<-"black"
colmat[7,6]<-"black"
colmat[8,6]<-"black"
colmat[9,6]<-"black"
colmat[10,6]<-"black"
colmat[11,6]<-"black"
colmat[12,6]<-"black"
colmat[13,6]<-"black"
colmat[14,6]<-"black"
colmat[14,7]<-"black"
colmat[15,7]<-"black"
colmat[16,7]<-"black"
colmat[15,8]<-"black"
colmat[16,8]<-"black"
colmat[15,9]<-"black"
colmat[16,9]<-"black"

plot(x="",y="",xlim=c(0,columns+8),ylim=c(0,rows+2),
xlab="",ylab="",yaxt="n",xaxt="n")

for (i in 1:columns){
  for (j in 1:rows){

  polygon(x=c(i-1,i-1,i,i),y=c(j-1,j,j,j-1),col=colmat[i,j]) #,lty="blank")

  }
}

vec<-c("N","J","P","M","I","F","E","A","B","O","L","G","D","C","H","K")
add<--0.5
lis<-0.5
for (i in 1:columns){
   text(i+add,rows+lis,vec[i])
}

segments(9,rows,9,rows+5)
segments(14,rows,14,rows+5)
text(4.5,11,"VILLAGES")
text(11,11,"TOWNS")
text(15,11,"CITIES")

tec<-c(
"1 High school         ",
"3 Railway station   ",
"8 Police station       ",
"2 Agricultural coop.",
"5 Veterinary            ",
"9 Land reallocation ",
"4 One-room school",
"6 No doctor            ",
"7 No water supply   ")
add<-3
lis<--0.5
for (i in 1:rows){
   text(columns+add,rows-i+1+lis,tec[i])
}

segments(columns,9,columns+30,9)
segments(columns,6,columns+30,6)
segments(columns,3,columns+30,3)
text(columns+7,7.5,"URBAN")
text(columns+7,1.5,"RURAL")
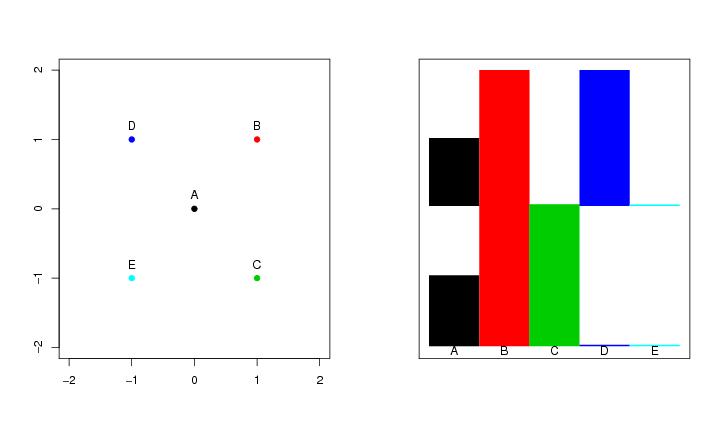
dendat<-t(matrix(c(0,0,1,1,1,-1,-1,1,-1,-1),2,5))

# frame 1
   plot(dendat,xlab="",ylab="",col=seq(1:2000),
   pch=19,xlim=c(-2,2),ylim=c(-2,2))
   p<-0.2
   text(0,0+p,"A")
   text(1,1+p,"B")
   text(1,-1+p,"C")
   text(-1,-1+p,"E")
   text(-1,1+p,"D")

# frame 2
   graph.matrix(dendat,type="profile",profcol=seq(1:2000),ylen=200)
   y<--2.5
   text(0.5,y,"A")
   text(1.5,y,"B")
   text(2.5,y,"C")
   text(3.5,y,"D")
   text(4.5,y,"E")
n<-200
d<-2
dendat<-sim.data(n=n,type="mulmod",seed=1)

k<-3
cl<-kmeans(dendat,centers=k)
ct<-cl$cluster
permu<-order(ct)

# frame 1
   plot(dendat,xlab="",ylab="")

# frame 2
   graph.matrix(dendat,type="profile")
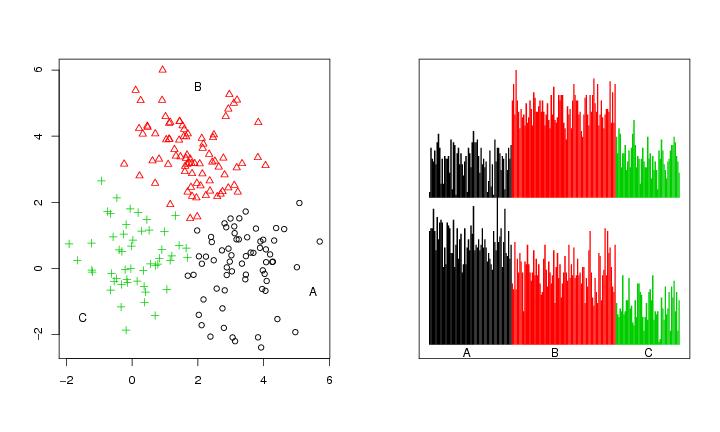
n<-200
d<-2
dendat<-sim.data(n=n,type="mulmod",seed=1)

k<-3
cl<-kmeans(dendat,centers=k)   #starters)
ct<-cl$cluster
permu<-order(ct)

# frame 1
   plot(dendat,xlab="",ylab="",col=ct,pch=ct)
   text(5.5,-0.7,"A")
   text(2,5.5,"B")
   text(-1.5,-1.5,"C")

# frame 2
   graph.matrix(dendat[permu,],type="profile",profcol=ct[permu])
   y<--2
   text(30,y,"A")
   text(100,y,"B")
   text(175,y,"C")

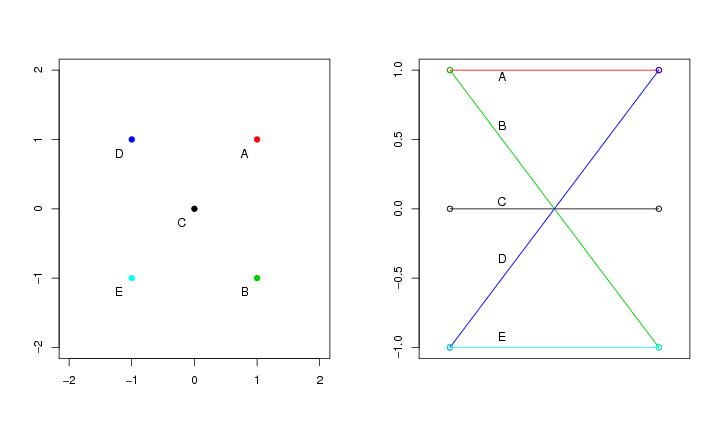
dendat<-t(matrix(c(0,0,1,1,1,-1,-1,1,-1,-1),2,5))

# frame 1
   plot(dendat,xlab="",ylab="",col=seq(1:2000),
   pch=19,xlim=c(-2,2),ylim=c(-2,2))
   p<-0.2
   text(0,0+p,"A")
   text(1,1+p,"B")
   text(1,-1+p,"C")
   text(-1,-1+p,"E")
   text(-1,1+p,"D")

# frame 2
   graph.matrix(dendat,segme=TRUE,poin=TRUE,epsi=0.1)
   y<-1.8
   p<-0.1
   text(y,1+p,"A")
   text(y,2+p,"B")
   text(y,3+p,"C")
   text(y,4+p,"D")
   text(y,5+p,"E")
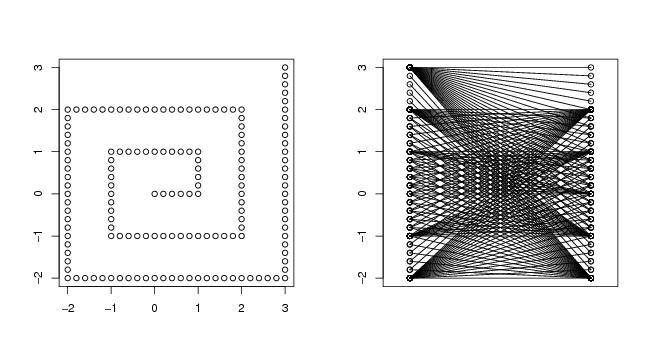
n<-200
d<-2
dendat<-sim.data(n=n,type="cross",seed=1)

# frame 1
   plot(dendat,xlab="",ylab="")

# frame 1
   graph.matrix(dendat,type="level",col=rep("black",1000),ystart=-7)
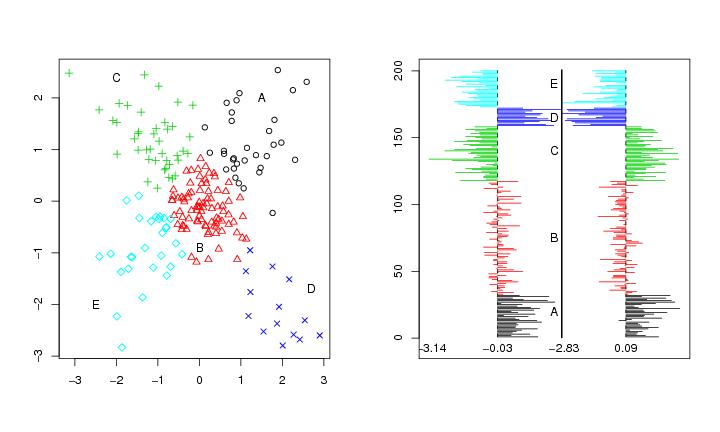
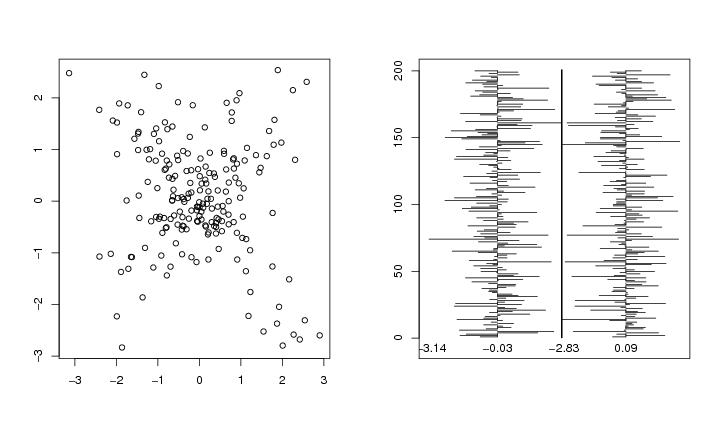
n<-200
d<-2
dendat<-sim.data(n=n,type="cross",seed=1)

k<-5
cl<-kmeans(dendat,centers=k)
ct<-cl$cluster
permu<-order(ct)

# frame 1
   plot(dendat,xlab="",ylab="",col=ct,pch=ct)
   text(0,-0.9,"B")
   text(1.5,2,"A")
   text(2.7,-1.7,"D")
   text(-2.5,-2,"E")
   text(-2,2.4,"C")

# frame 2
   graph.matrix(dendat[permu,],type="level",col=ct[permu],ystart=-7)
   y<-5.7
   text(y,20,"A")
   text(y,75,"B")
   text(y,140,"C")
   text(y,165,"D")
   text(y,190,"E")
dendat.4<-t(matrix(c(0,0,1,1,1,-1,-1,1,-1,-1),2,5))

# frame 1
   plot(dendat.4,xlab="",ylab="",col=seq(1:2000),pch=19,
   xlim=c(-2,2),ylim=c(-2,2))
   h<-0.2
   text(-1-h,-1-h,"E")
   text(+1-h,-1-h,"B")
   text(+1-h,+1-h,"A")
   text(-1-h,+1-h,"D")
   text(-h,-h,"C")

# frame 2
   paracoor(dendat.4,paletti=seq(1:2000))
   h<-1.25
   text(h,+0.95,"A")
   text(h,+0.6,"B")
   text(h,+0.05,"C")
   text(h,-0.36,"D")
   text(h,-0.92,"E")
seed<-1
type<-"cross"
n<-500
d<-2
dendat<-sim.data(n=n,type=type,seed=seed)

# frame 1
   plot(dendat,xlab="",ylab="")

# frame 2
   paracoor(dendat)
spiral<-function(d,lkm,hila=3)
{
n<-1
for (i in 1:lkm) n<-n+d*i*hila
curve<-matrix(0,n,d)
level<-matrix(0,n,1)
point<-2
step<-0
sign<--1
cur<-curve[1,]
for (i in 1:lkm){
step<-step+1
sign<--sign
for (j in 1:d){
dire<-rep(0,d)
dire[j]<-1
add<-step*sign*dire
nstep<-i*hila
for (k in 1:nstep){
curve[point,]<-cur+add/nstep
level[point]<-level[point-1]+1/nstep
cur<-curve[point,]
point<-point+1
}
}
}
return(list(curve=curve,level=level))
}
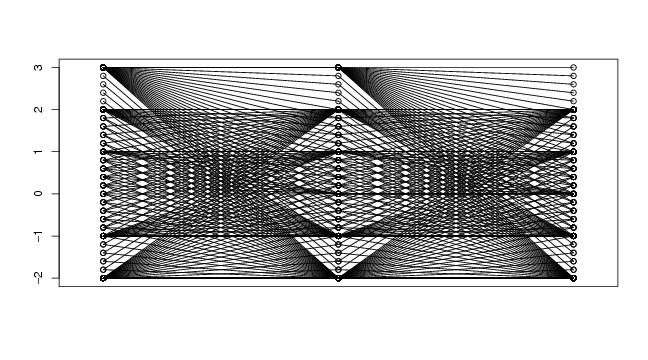
# frame 1
d<-2
lkm<-5
hila=5
spi<-spiral(d,lkm,hila)
plot(spi$curve[,1],spi$curve[,2],#type="l",
xlab="",ylab="")
# frame 2
paracoor(spi$curve)
spiral2d<-function(a,n,lkm=3,type="archimed")
{
d<-2
end<-lkm*2*pi
step<-end/n
curve<-matrix(0,n,d)
level<-matrix(0,n,1)
if (type=="archimed"){
for (i in 1:n){
phi<-i*step
r<-a*phi
curve[i,1]<-r*cos(phi)
curve[i,2]<-r*sin(phi)
level[i]<-r
}
}
if (type=="hyperbol"){
for (i in 1:n){
phi<-i*step
r<-a/phi
curve[i,1]<-r*cos(phi)
curve[i,2]<-r*sin(phi)
level[i]<-r
}
}
return(list(curve=curve,level=level))
}
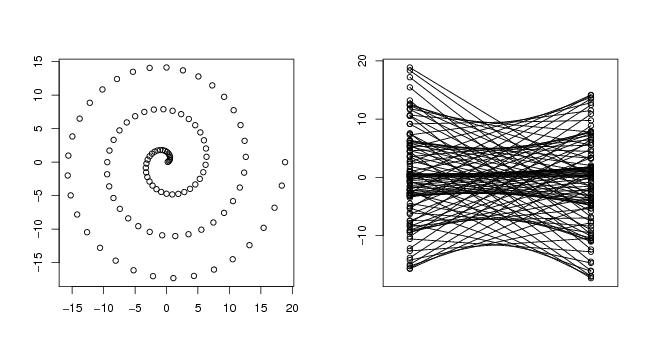
# frame 1
a<-1
n<-100
lkm<-3
type<-"archimed"
spi<-spiral2d(a,n,lkm,type)
plot(spi$curve[,1],spi$curve[,2],xlab="",ylab="")
# frame 2
dendat<-spi$curve
paracoor(dendat)

# frame 1
a<-1
low<-0.05
end<-2
n<-100
step<-(end-low)/n
curve<-matrix(0,n,2)
phiend<-1/(low+step)
philow<-1/(low+n*step)
phistep<-(phiend-philow)/n
for (i in 1:n){
       phi<-philow+i*phistep
       r<-a/phi
       curve[i,1]<-r*cos(phi)
       curve[i,2]<-r*sin(phi)
}
plot(curve,xlab="",ylab="")

# frame 2
paracoor(curve)
spiral<-function(d,lkm,hila=3)
{
n<-1
for (i in 1:lkm) n<-n+d*i*hila
curve<-matrix(0,n,d)
level<-matrix(0,n,1)

point<-2
step<-0
sign<--1
cur<-curve[1,]
for (i in 1:lkm){
   step<-step+1
   sign<--sign
   for (j in 1:d){
        dire<-rep(0,d)
        dire[j]<-1
        add<-step*sign*dire
        nstep<-i*hila
        for (k in 1:nstep){
               curve[point,]<-cur+add/nstep
               level[point]<-level[point-1]+1/nstep

               cur<-curve[point,]
               point<-point+1
        }
   }
}

return(list(curve=curve,level=level))
}

# frame
   d<-3
   lkm<-5
   hila<-5
   spi<-spiral(d,lkm,hila)
   paracoor(spi$curve)
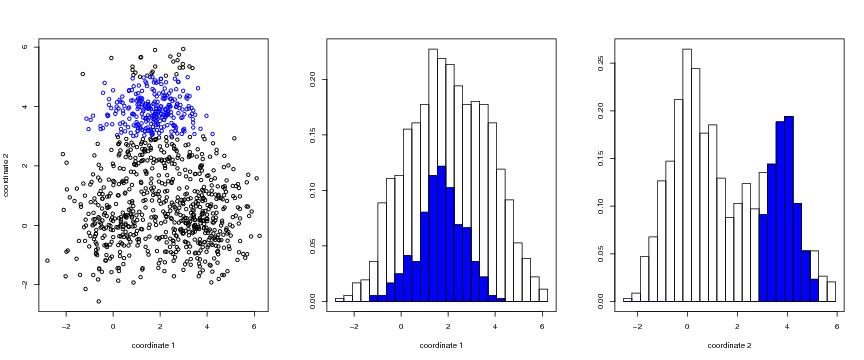
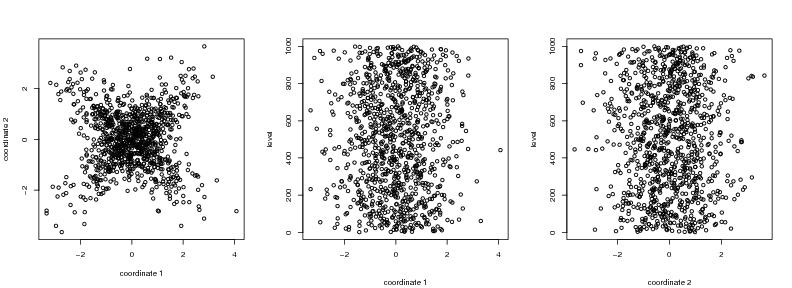
n<-1000
siemen<-5
dendat<-sim.data(n=n,seed=siemen,type="mulmod")

dendat1<-dendat[,1]
dendat2<-dendat[,2]

binlkm<-25

brush<-matrix(0,n,1)
brushcol<-matrix("black",n,1)
for (i in 1:n){
    if ((dendat[i,2]<=5) && (dendat[i,2]>=3)){
             brush[i]<-1
             brushcol[i]<-"blue"
    }
}

# frame 1
plot(dendat,xlab="coordinate 1",ylab="coordinate 2",
col=brushcol)

# frame 2
histo1d(dendat1,binlkm=binlkm,brush=brush, xlab="coordinate 1",)

# frame 3
histo1d(dendat2,binlkm=binlkm,brush=brush, xlab="coordinate 2")
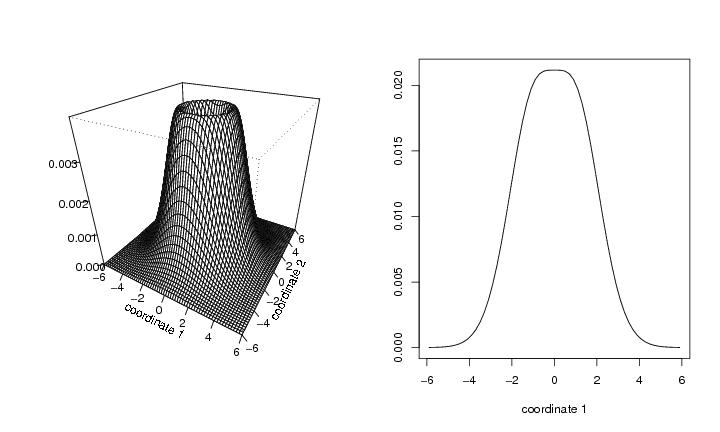
func<-"hat"
yla<-6;ala<--yla;support<-c(ala,yla,ala,yla)

a<-0.5
b<-1

# frame 1
N<-c(60,60)
pcf<-eval.func.dD(func,N,support=support,a=a,b=b)
dp<-draw.pcf(pcf,pnum=N)
persp(dp$x,dp$y,dp$z,phi=30,theta=30,
ticktype="detailed",xlab="coordinate 1",ylab="coordinate 2",zlab="")

# frame 2
pcf1<-eval.func.1D(func,N=60,support=c(ala,yla),a=a,b=b,d=2)
dp1<-draw.pcf(pcf1,pnum=c(30))
plot(dp1$x,dp1$y,type="l",xlab="coordinate 1",ylab="")