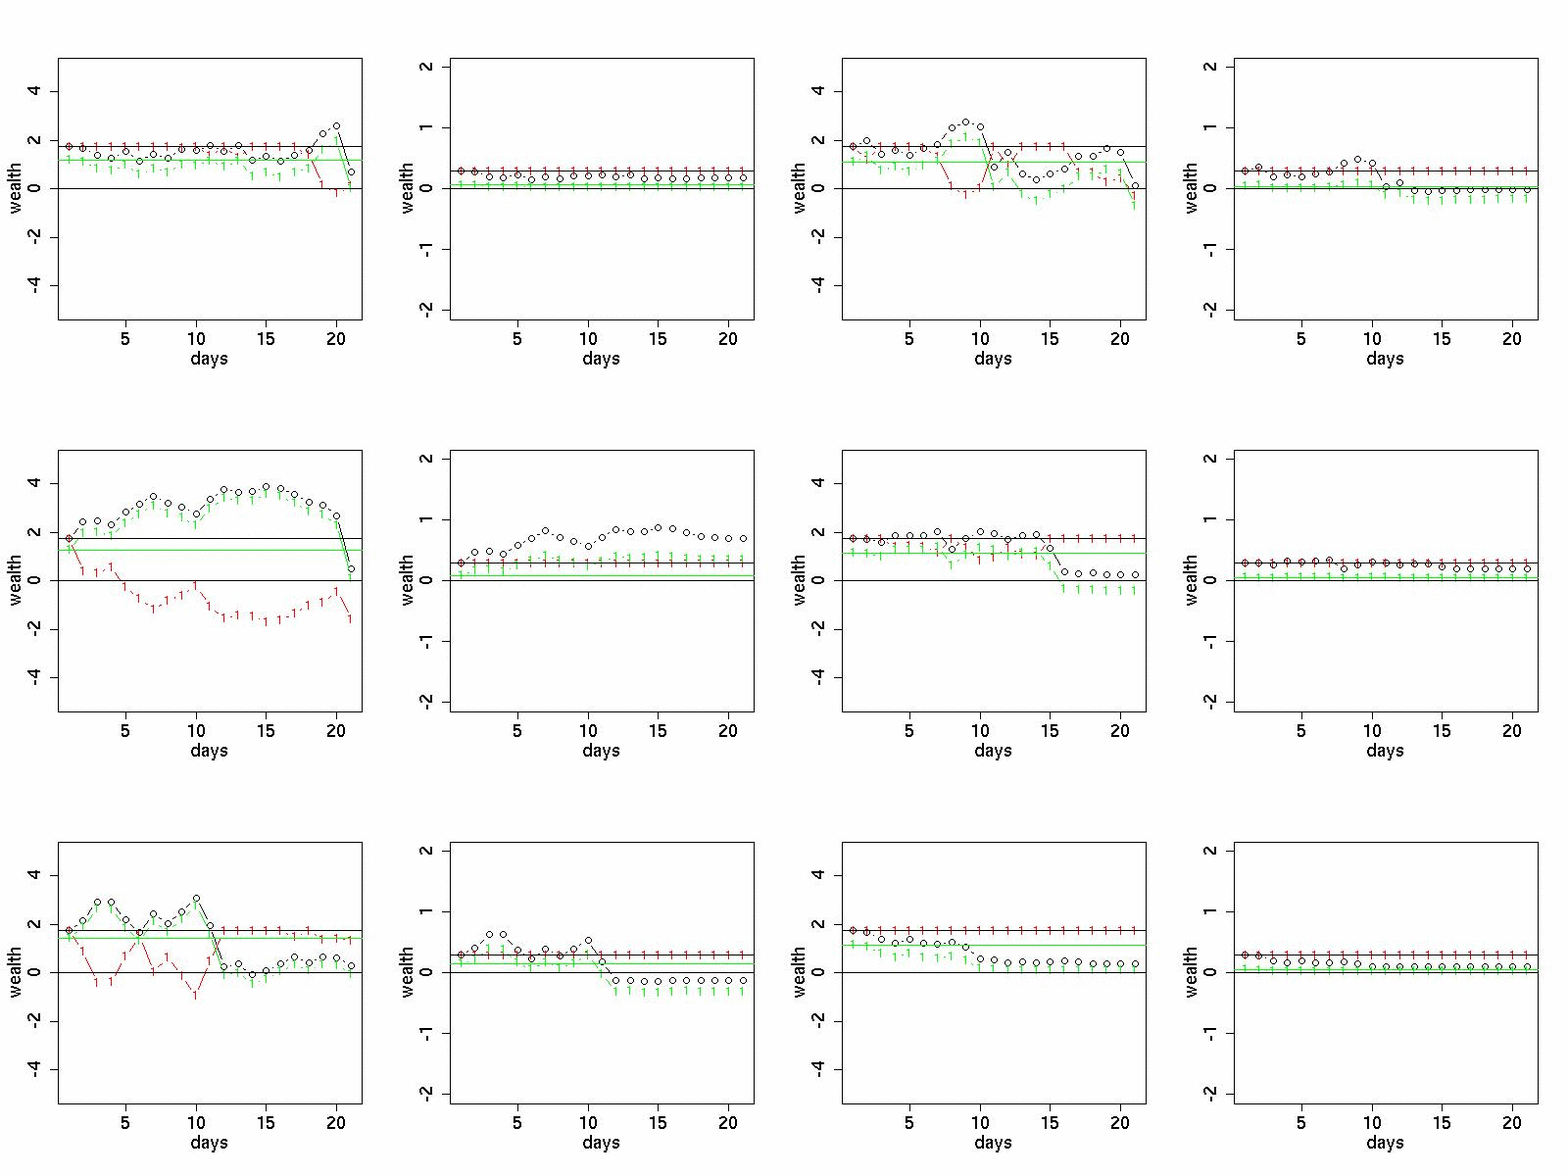
The red curve shows the optium premium minus the instrinsic value of the option. The black curve shows the wealth of the writer of the option when delta hedging is used with the volatility equal to the sample standard deviation. The green curve shows the wealth of the writer of the option when delta hedging is used with the volatility equal to the GARCH(1,1) volatility.
In the left panel the stock value is S=100 at the beginning and the strike price is K=100.
In the right panel the stock value is S=100 at the beginning and the strike price is K=105.
