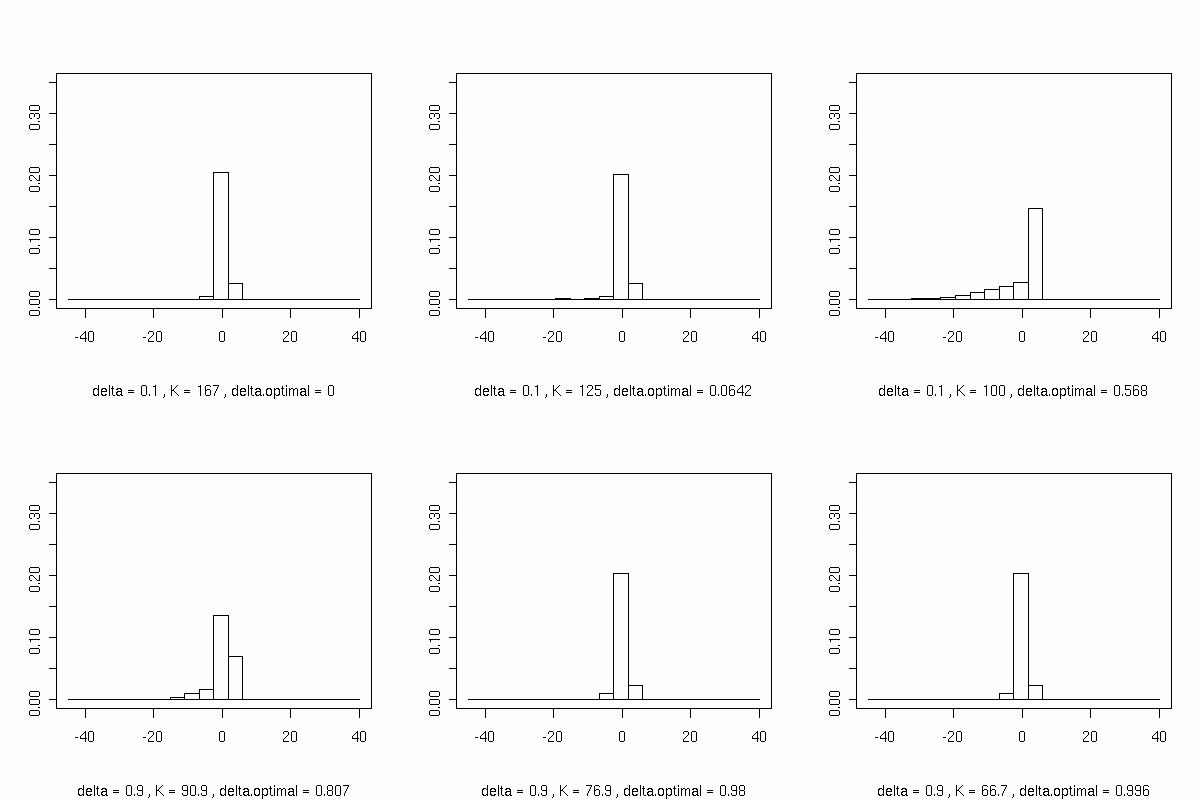
The animation shows histograms of payout distributions when an European call is written and hedged with a single period hedging. The distribution of the asset follows geometric Student process, with degrees of freedom 4.
The hedging parameter varies between 0.1-0.9 and the moneyness index varies between 0.6 and 1.5, where the moneyness is defined as S0/K, where S0 is the initial asset price and K is the strike price. The initial asset price is taken to be 100.
The yearly volatility is 0.2, the time to expiration is 0.25 in fractions of year, the risk free interest rate is 0. The histograms are based on 1000 simulated trajectories and have 20 bins.
