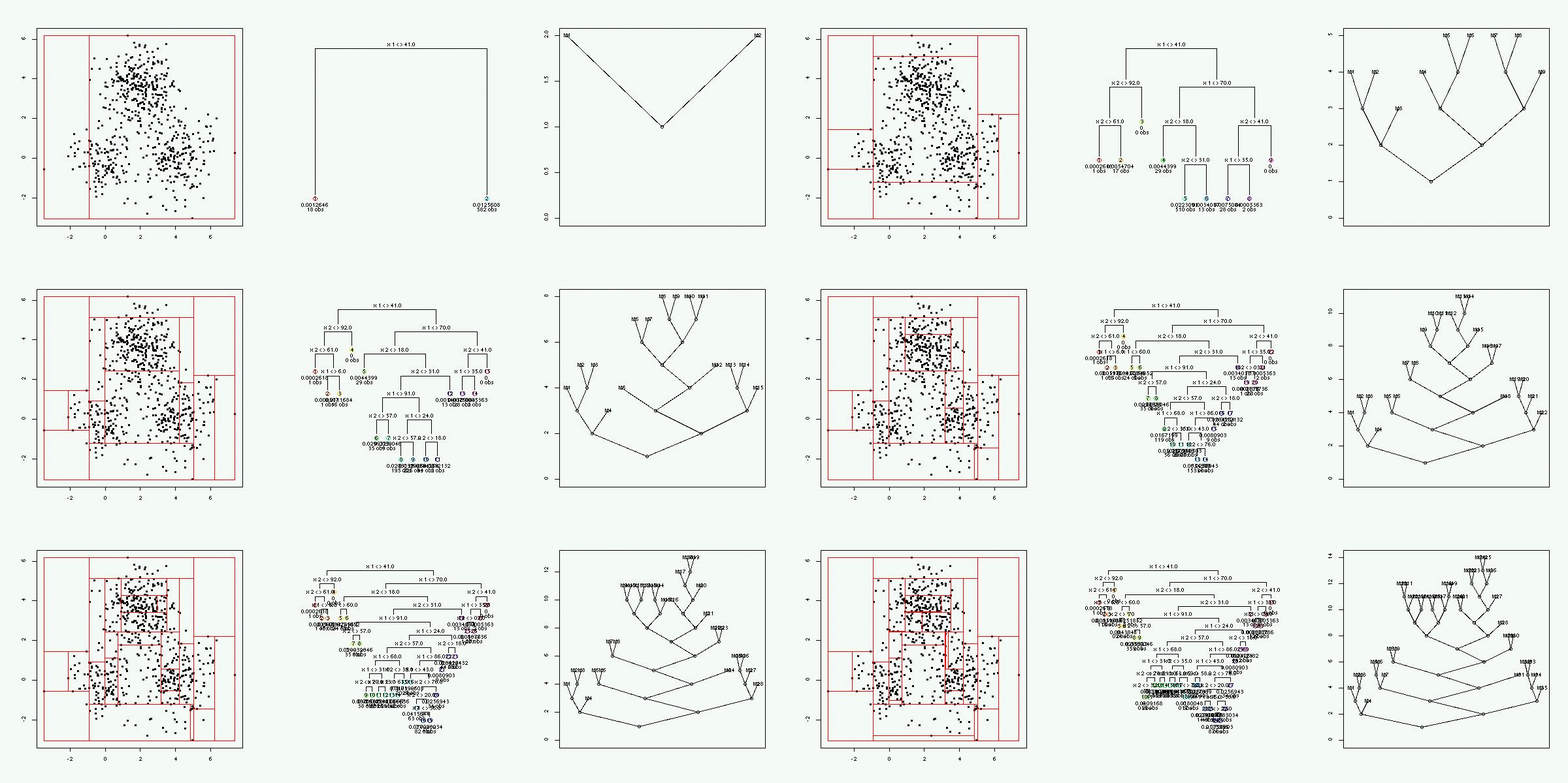
Greedy histograms may be visualized by showing the binary trees that represent the function.

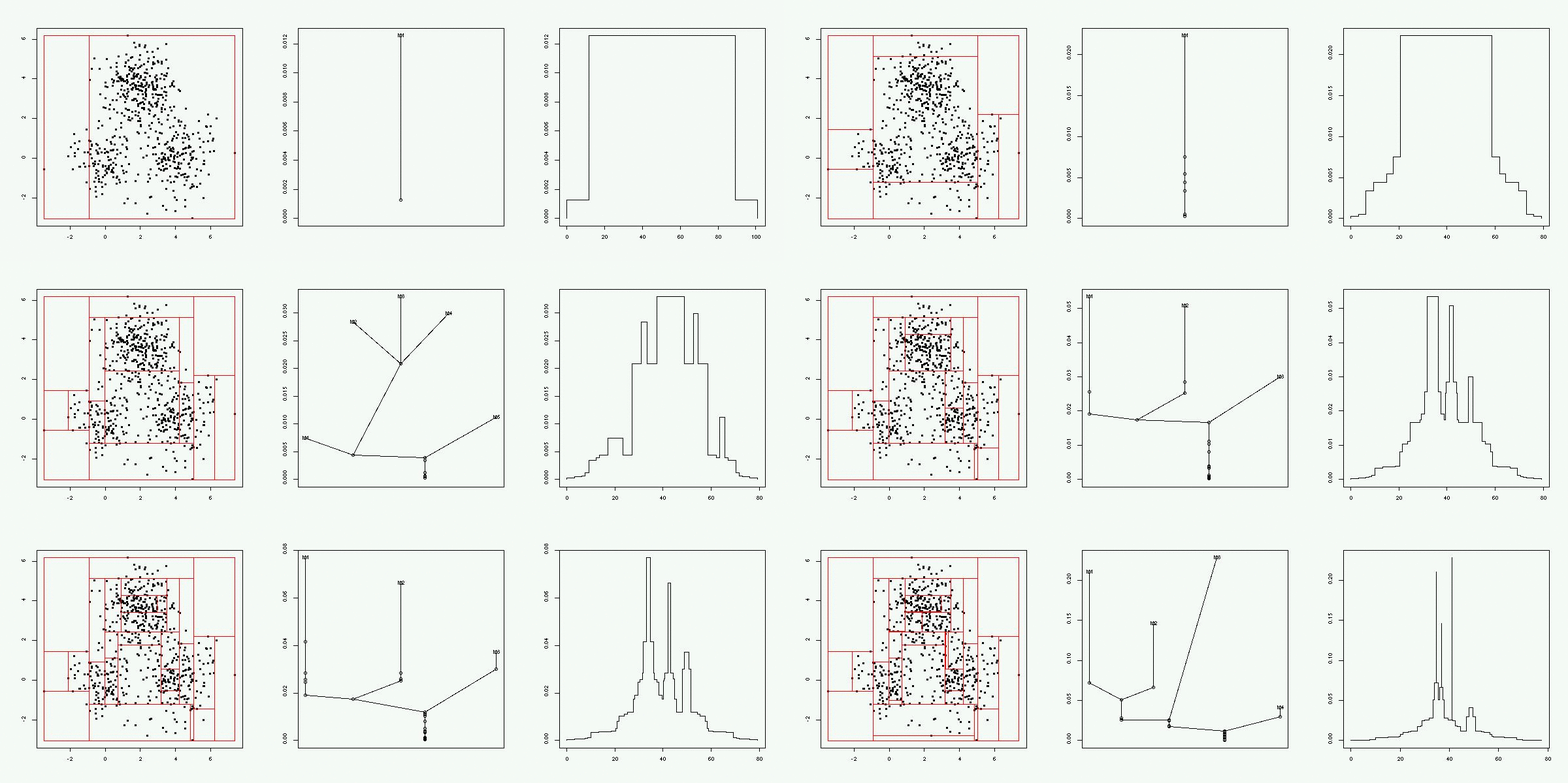
A better visualization is provided by level set trees. The level set tree shows the number of modes and the heights of the modes. The volume plot visualizes the largeness of the modes.
