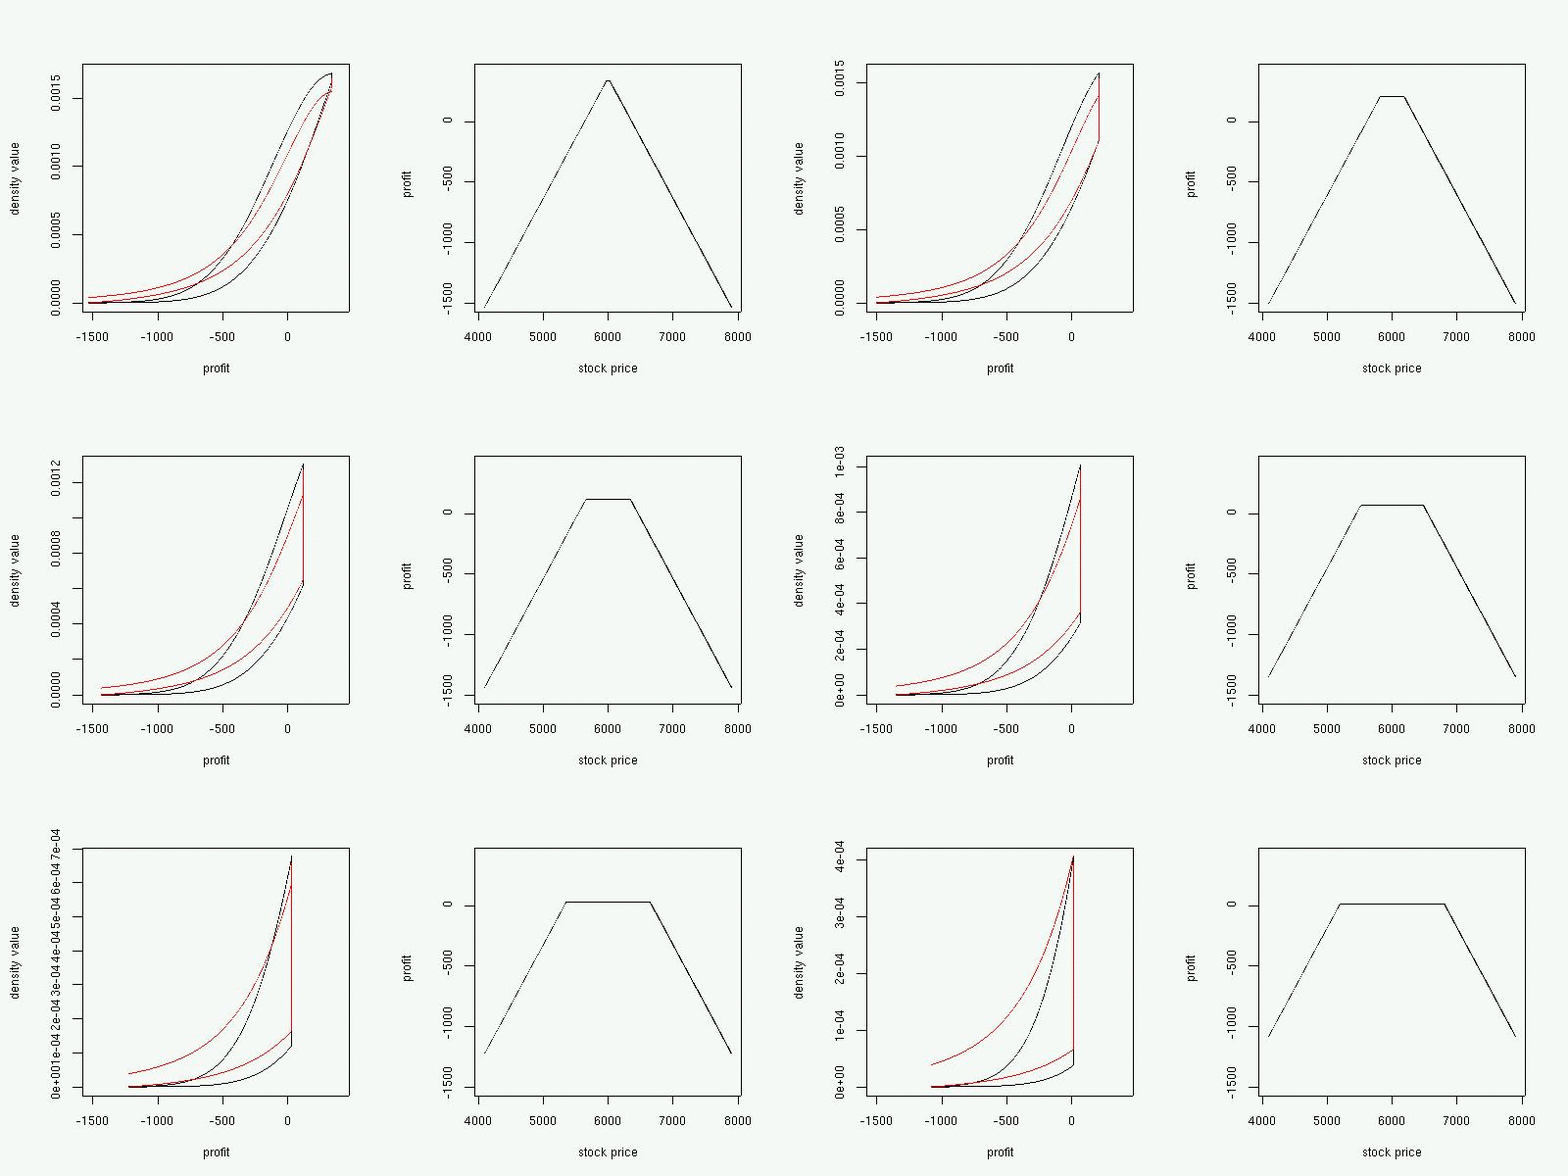
The left figure shows the profit distributions for the strangles with strike prices in the range from 6000-800 to 6000+800. The current price is 6000 and the maturity is in 90 days. The left frame shows the distribution function of the profit and the density of the continuous part is also shown. The distribution is otherwise continuous, but there is a jump at the end. The y-scale is the scale of the density.
The black graphs show the case where the distribution of the increments of the price is assumed to be a normal distribution. The red graphs show the case where it is assumed to be a Student distribution with degrees of freedom 3.
The right frame shows the profit diagrams.
