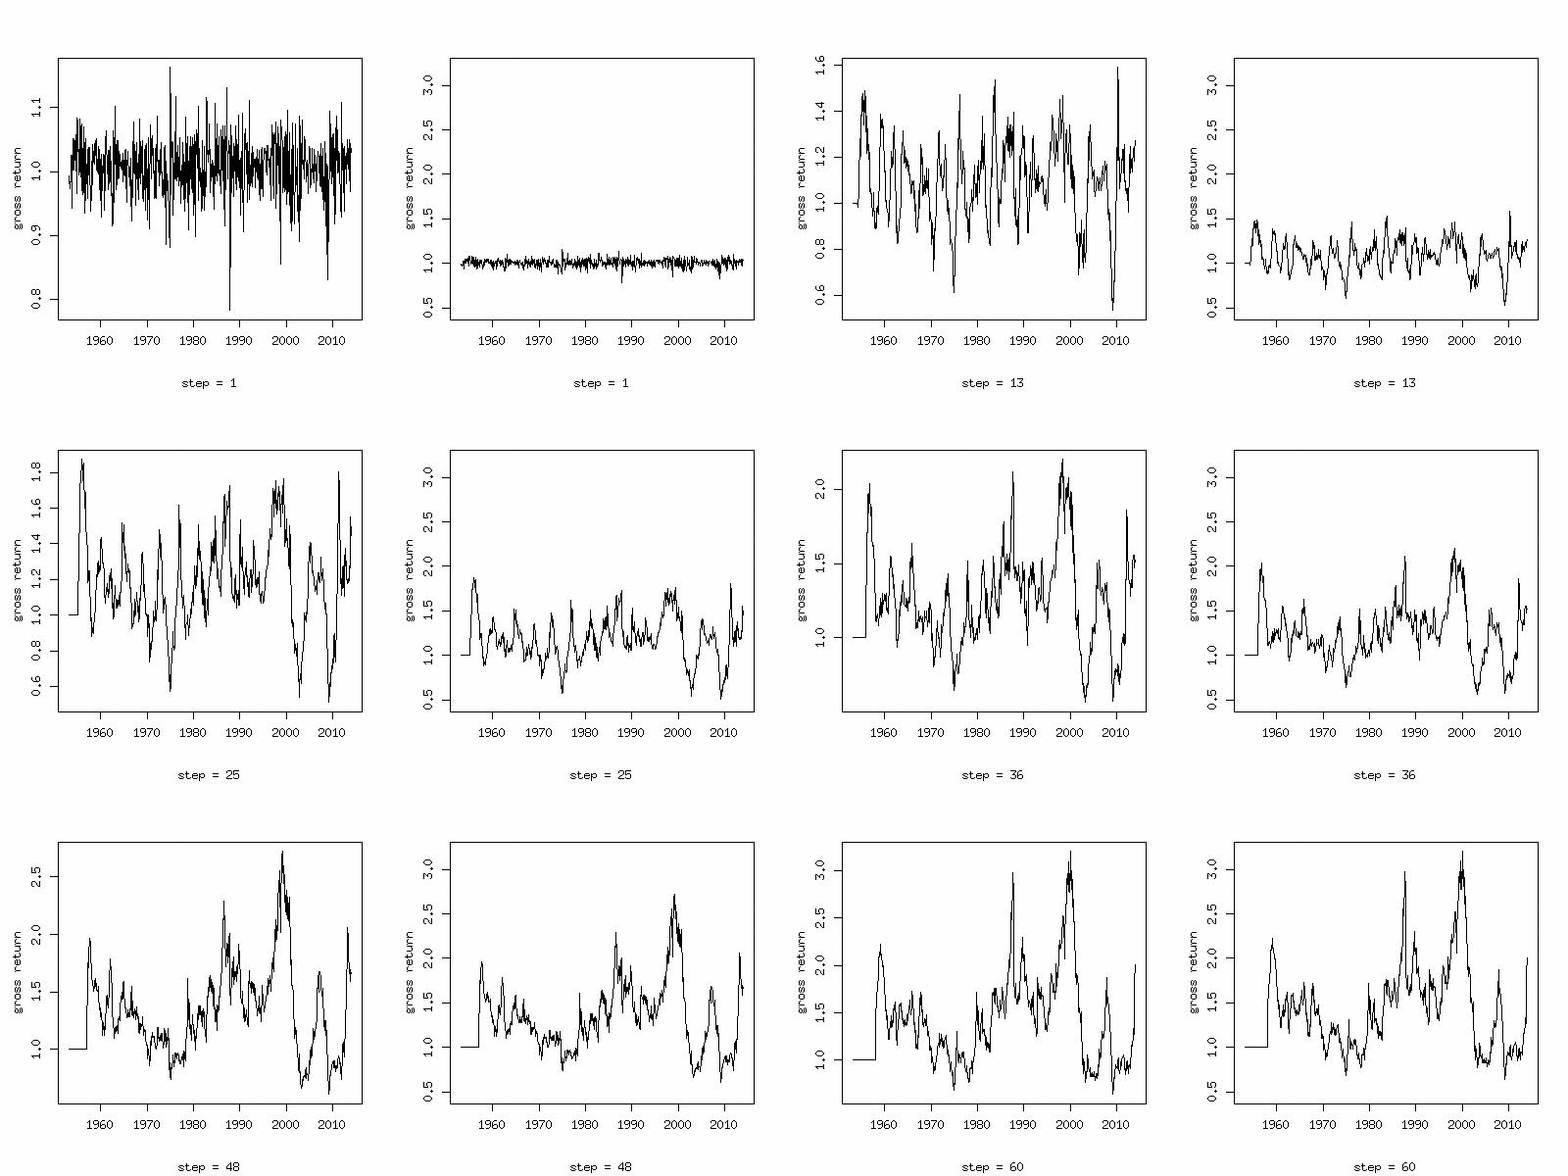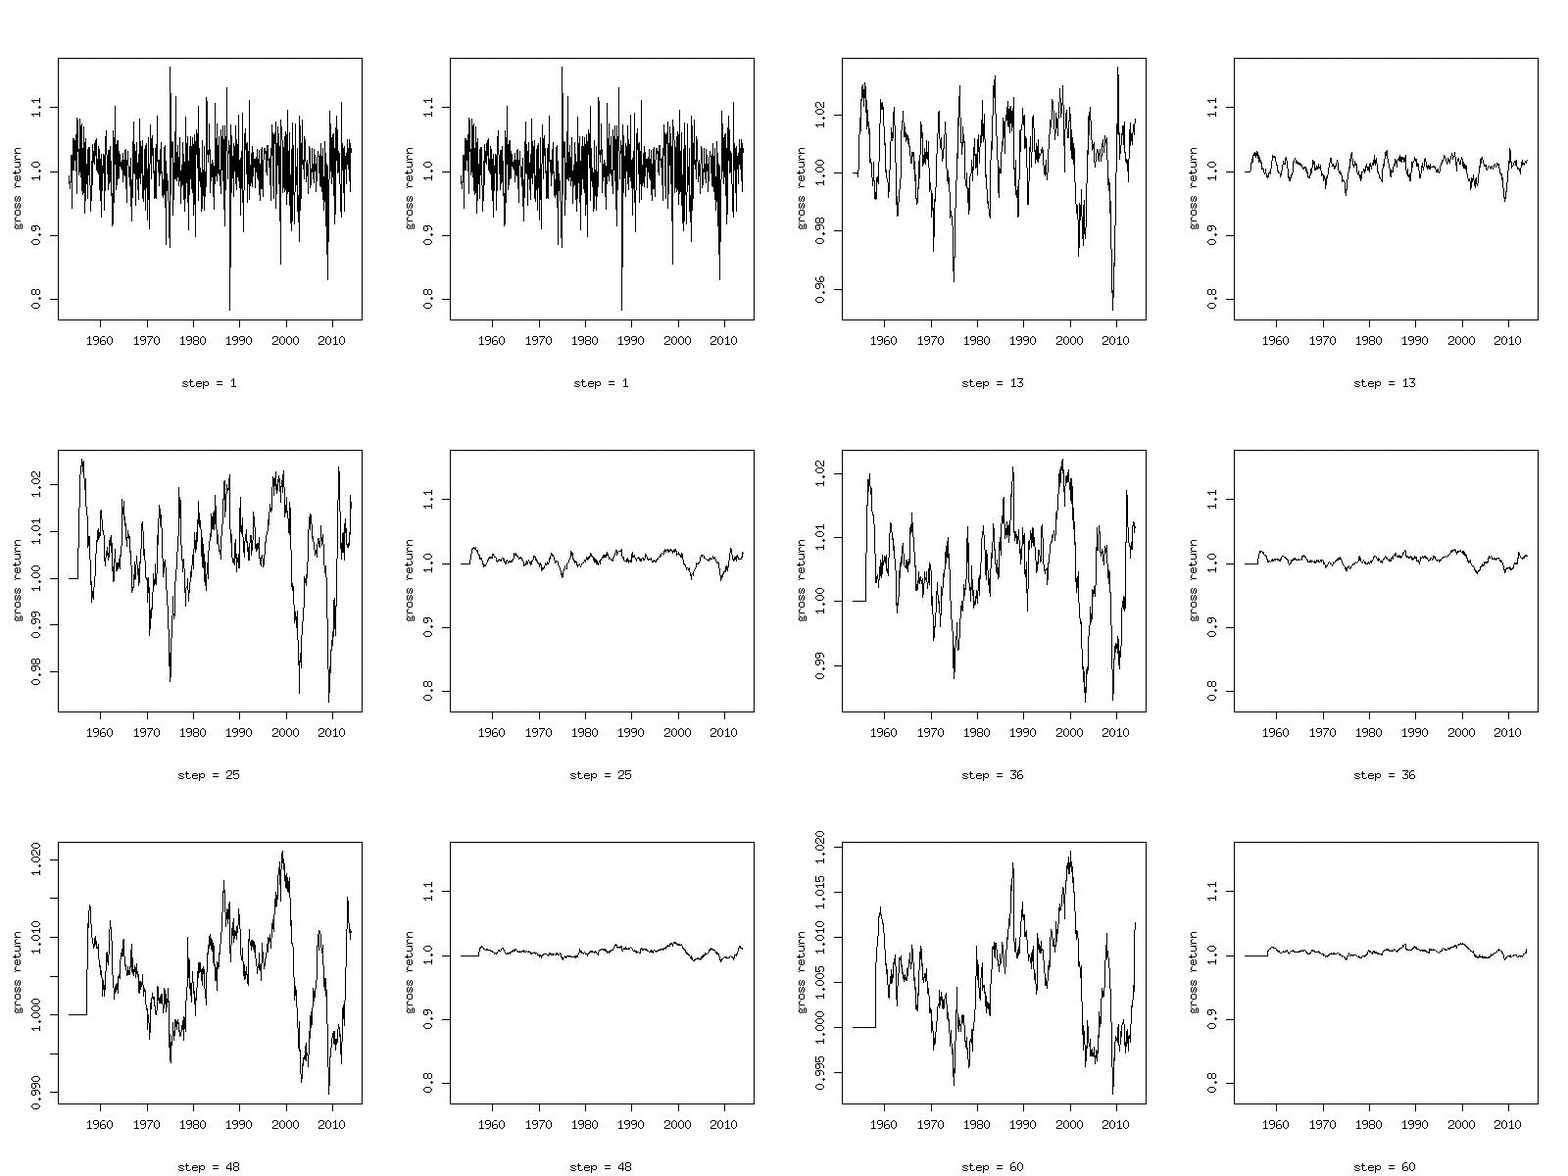
The returns of SP500 index are shown for various return horizons.
The first figure shows the gross returns with horizons from 1 month to 5 years; it shows the s-month returns for s=1,...,60. In the left panel the y-axis is different for each return horizon but in the right panel the y-axis is same for each return horizon.

The second figure is otherwise similar to the first figure but now the gross returns are talen to the power 1/s, where s is the return horizon. This means that we show the geometric means of the monthly returns. The geometric means make a time series with an autocorrelation larger when the return horizon is larger.
