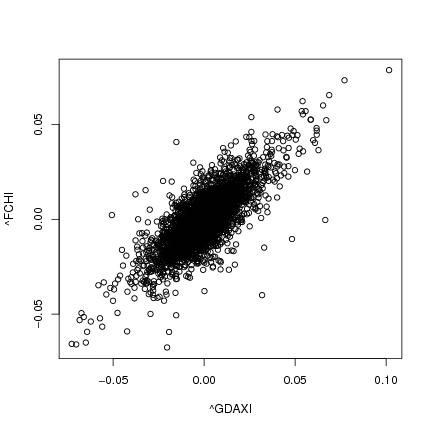
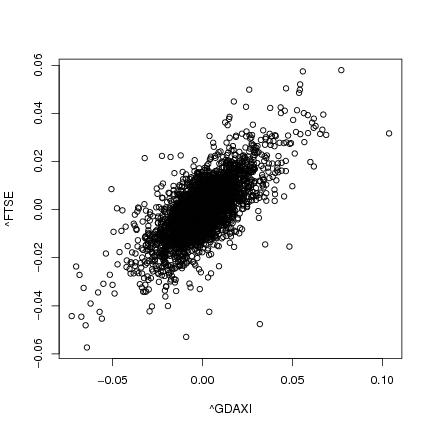
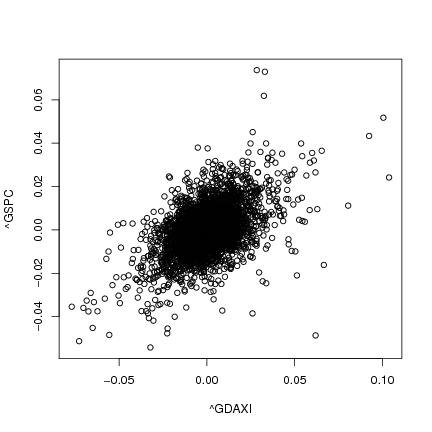
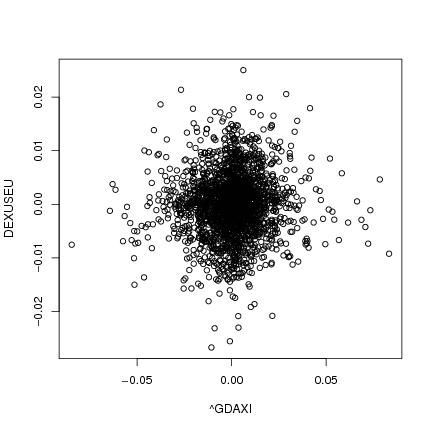
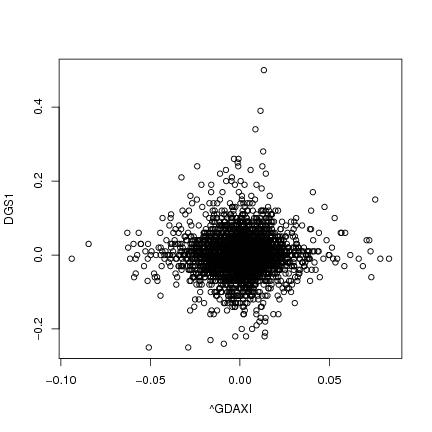
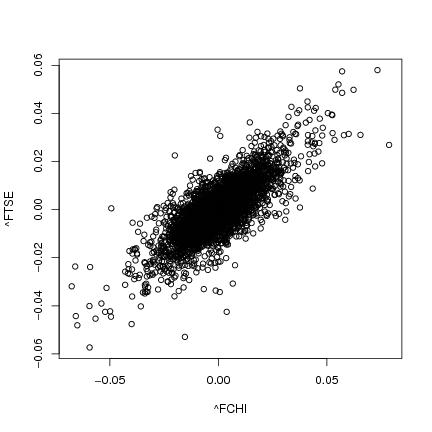


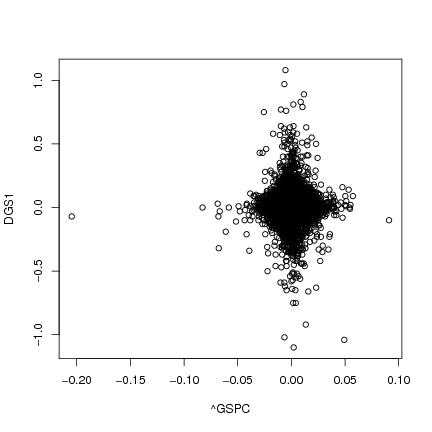
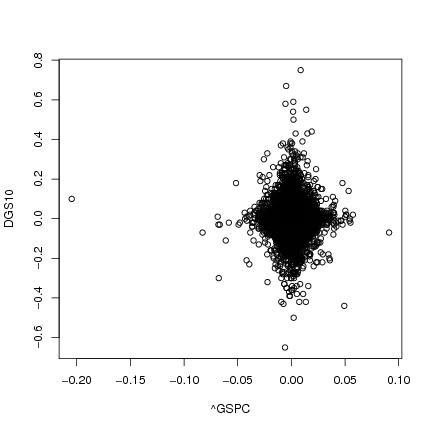
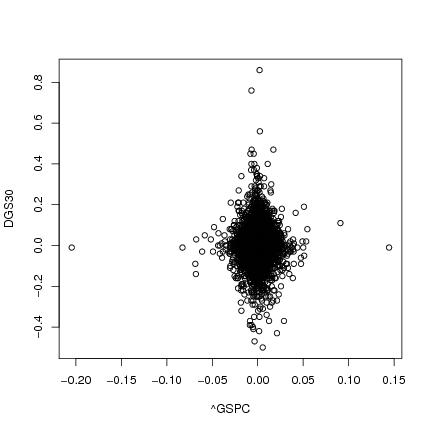
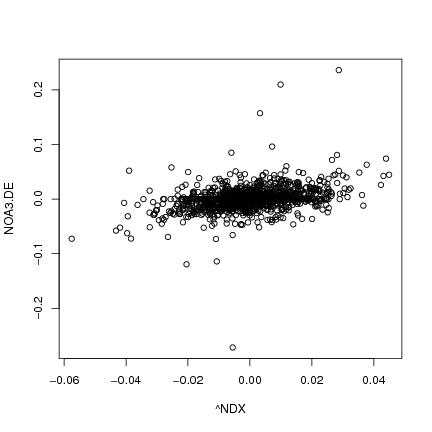
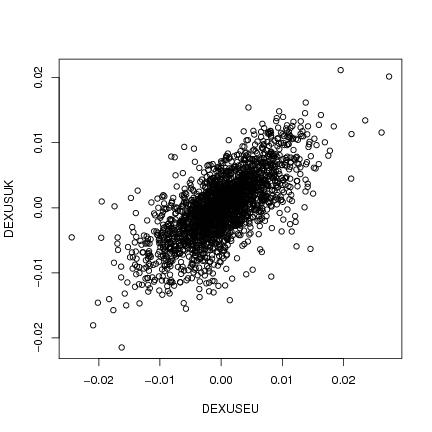

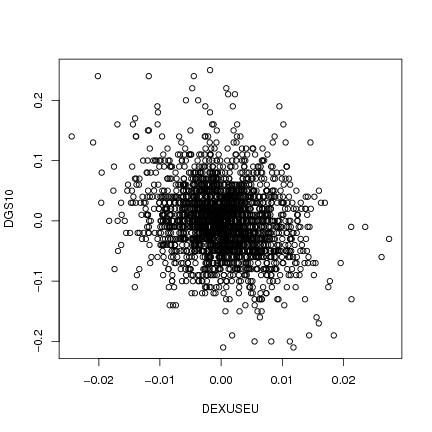

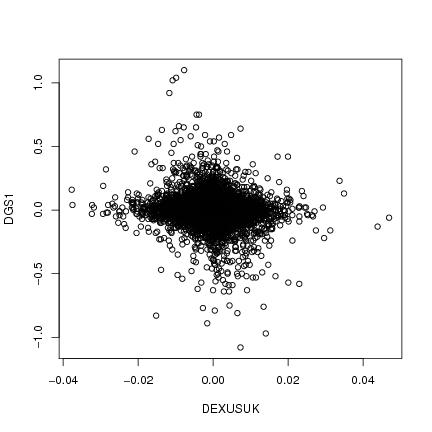

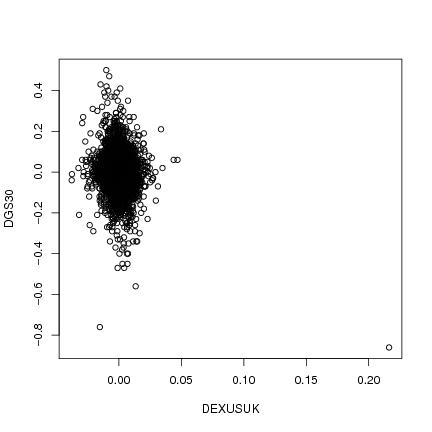
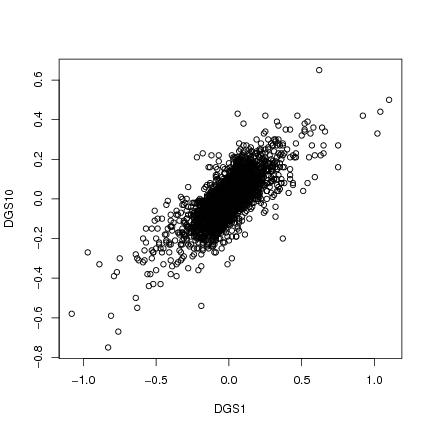
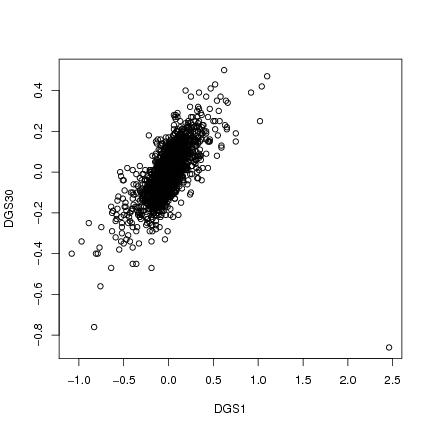
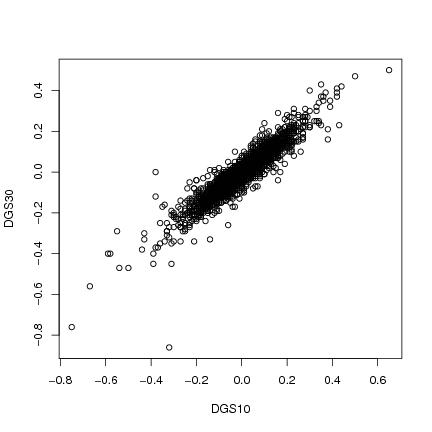
We visualize the dependence of various financial variables with scatter matrices. We calculate the daily returns from stock prices and exchange rates and the daily differences from the rates.
DGS1 means 1-Year Treasury Constant Maturity Rate, DGS10 10-Year, and DGS30 30-Year.
| DAX | CAC | FTSE | SP500 | Nasdaq | EU/US | UK/US | DGS1 | DGS10 | DGS30 | NOK | DAX |
|
|
|
|
|
| CAC |
|
||||||||||
| FTSE |
|
||||||||||
| SP500 |
|
|
|
|
|||||||
| Nasdaq |
|
||||||||||
| EU/US |
|
|
|
|
|||||||
| UK/US |
|
|
|
||||||||
| DGS1 |
|
|
|||||||||
| DGS10 |
|
||||||||||
| DGS30 | |||||||||||
| NOK |