
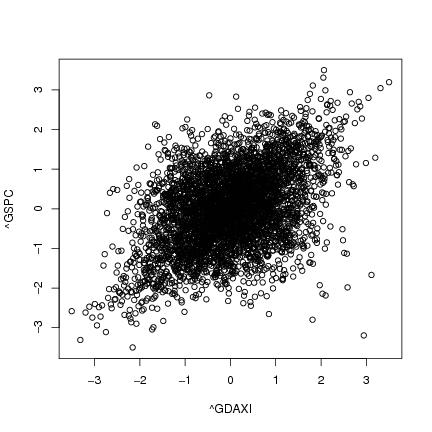

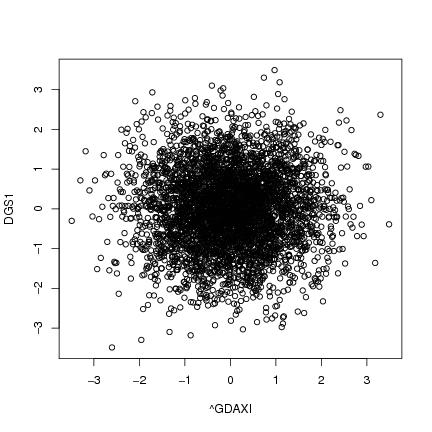
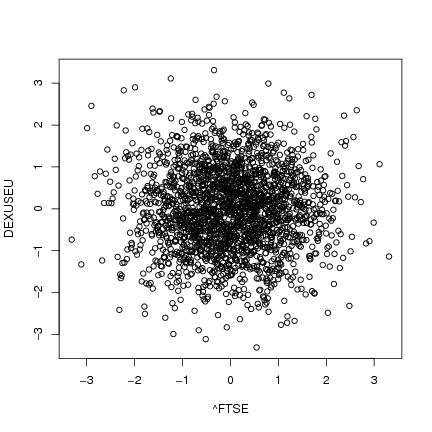
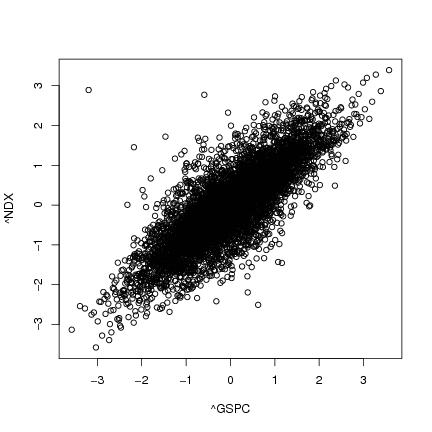
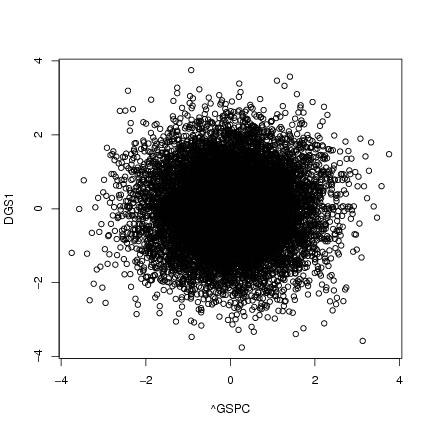
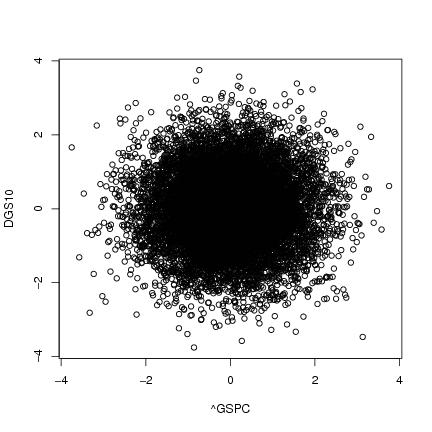
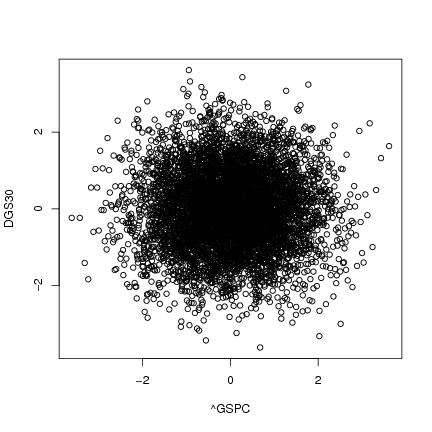
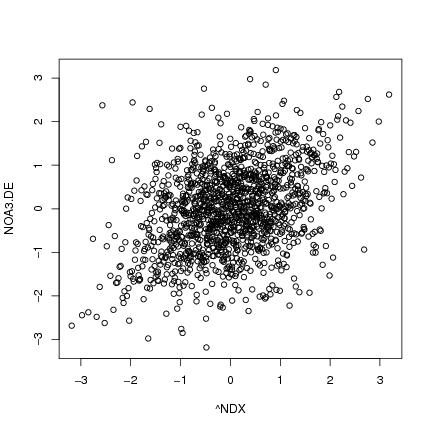
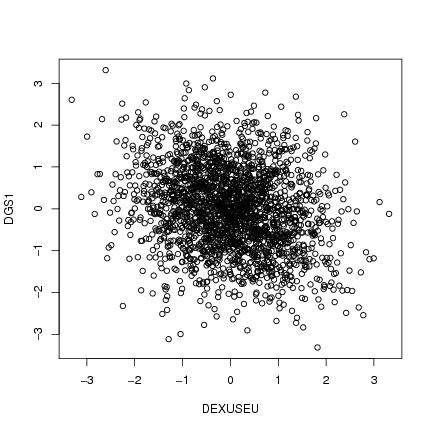

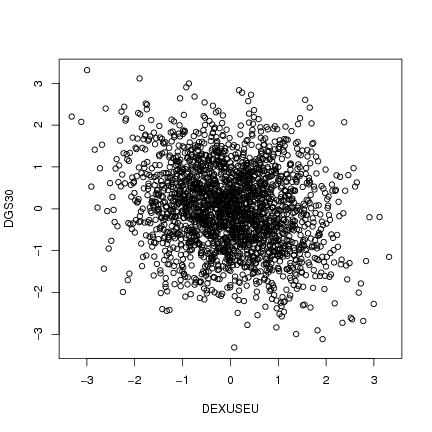
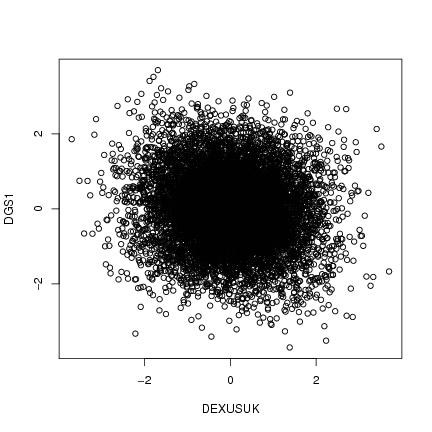
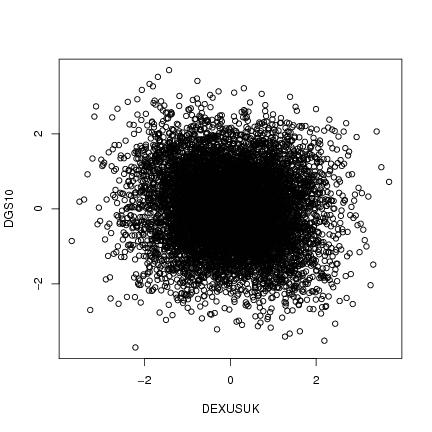
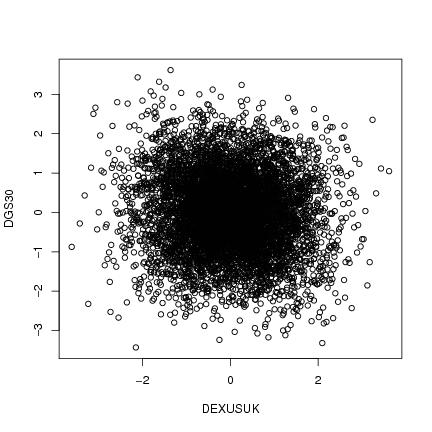
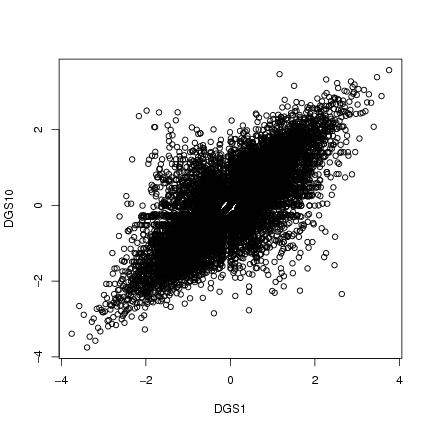
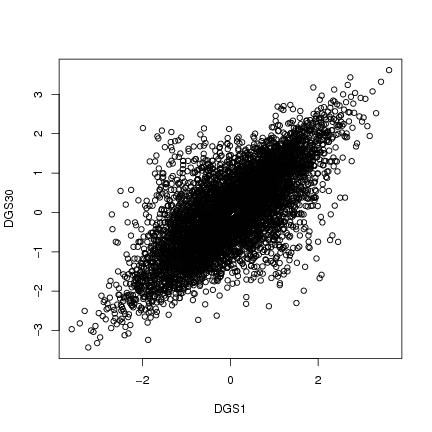
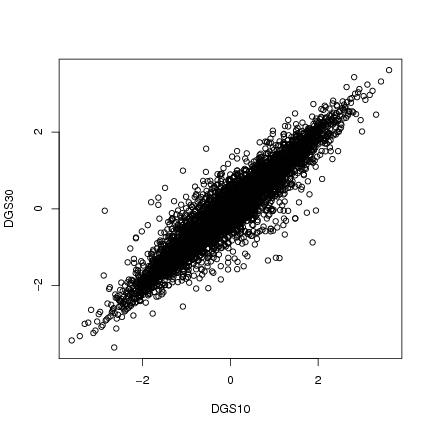
We visualize the dependence of various financial variables with scatter matrices. We calculate the daily returns from stock prices and exchange rates and the daily differences from the rates. The data is normalized so that the marginal distributions are approximately standard Gaussian.
DGS1 means 1-Year Treasury Constant Maturity Rate, DGS10 10-Year, and DGS30 30-Year.
| DAX | CAC | FTSE | SP500 | Nasdaq | EU/US | UK/US | DGS1 | DGS10 | DGS30 | NOK | DAX |
|
|
|
|
|
| CAC |
|
||||||||||
| FTSE |
|
||||||||||
| SP500 |
|
|
|
|
|||||||
| Nasdaq |
|
||||||||||
| EU/US |
|
|
|
|
|||||||
| UK/US |
|
|
|
||||||||
| DGS1 |
|
|
|||||||||
| DGS10 |
|
||||||||||
| DGS30 | |||||||||||
| NOK |